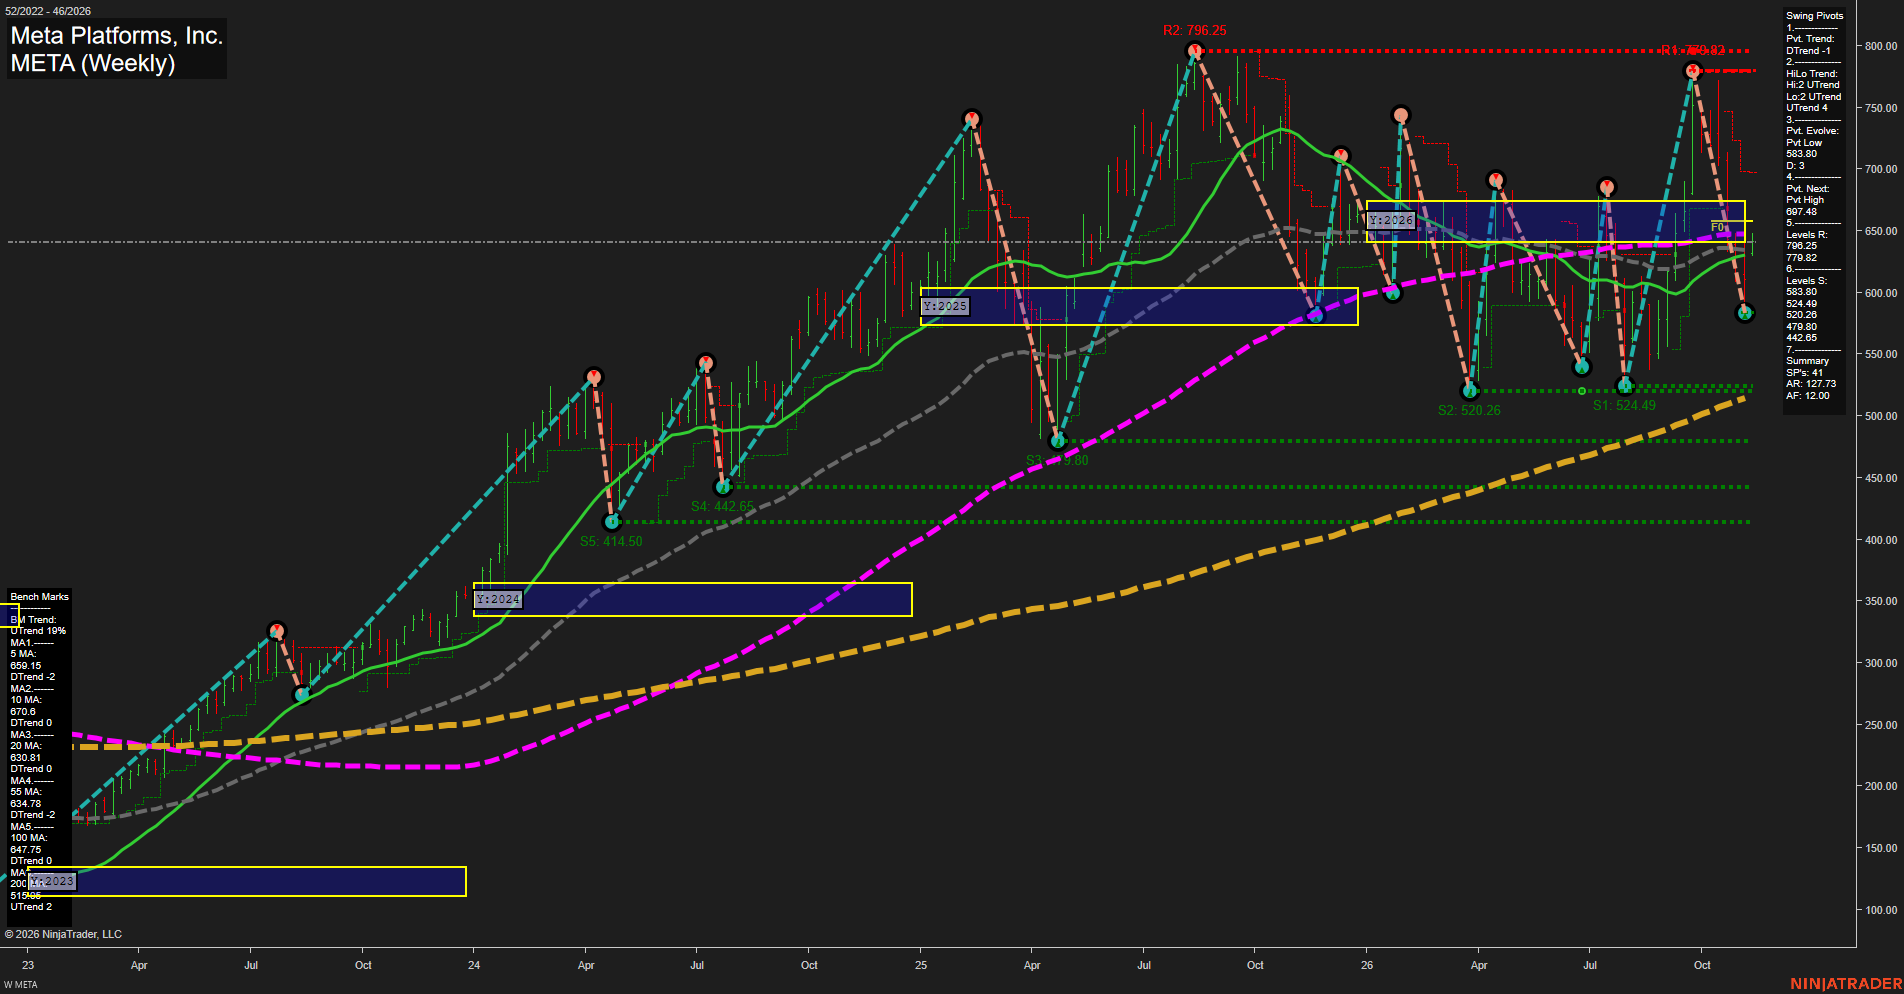
META Meta Platforms; Inc. Weekly Chart Analysis: 2026-Nov-10 07:09 CT
Price Action
- Last: 647.38,
- Bars: Medium,
- Mom: Average.
WSFG Weekly
- Short-Term
- WSFG Current: N/A%
- F0%/NTZ' Bias: Price Neutral,
- WSFG Trend: Neutral.
MSFG Month Nov
- Intermediate-Term
- MSFG Current: N/A%
- F0%/NTZ' Bias: Price Neutral,
- MSFG Trend: Neutral.
YSFG Year 2026
- Long-Term
- YSFG Current: Near 0%
- F0%/NTZ' Bias: Price Neutral,
- YSFG Trend: Neutral.
Swing Pivots
- (Short-Term) 1. Pvt. Trend: DTrend,
- (Intermediate-Term) 2. HiLo Trend: UTrend,
- 3. Pvt. Evolve: Pvt low 583.80,
- 4. Pvt. Next: Pvt high 697.48,
- 5. Levels R: 796.25, 779.82,
- 6. Levels S: 583.80, 524.49, 520.26, 479.80, 442.65, 414.50.
Weekly Benchmarks
- (Short-Term) 5 Day: 659.16 Down Trend,
- (Short-Term) 10 Day: 670.08 Down Trend,
- (Intermediate-Term) 20 Day: 630.90 Down Trend,
- (Intermediate-Term) 55 Day: 634.78 Down Trend,
- (Long-Term) 100 Day: 647.75 Down Trend,
- (Long-Term) 200 Day: 515.82 Up Trend.
Overall Rating
- Short-Term: Bearish,
- Intermediate-Term: Bearish,
- Long-Term: Neutral.
Key Insights Summary
META is rotating lower from the 779.82 pivot high within a broader higher-level structure. Short-term pivot direction and the 5-, 10-, 20-, 55-, and 100-period benchmarks remain downward, while price is testing the yearly F0%/NTZ area near the 100-period average. The intermediate HiLo trend remains positive because the larger swing-support structure has not broken, with 583.80 the key active pivot-low support. The long-term structure is mixed: the 200-period benchmark remains rising, but price is below the short and intermediate benchmark cluster. The current pattern is a volatile retracement/consolidation between 583.80 support and 697.48 reversal resistance, with 779.82 and 796.25 defining the higher resistance zone.
Chart Analysis ATS AI Generated: 2026-11-10 07:09 for Informational use only, not trading advice. Terms and Risk Disclosure Copyright © 2026. Algo Trading Systems LLC.