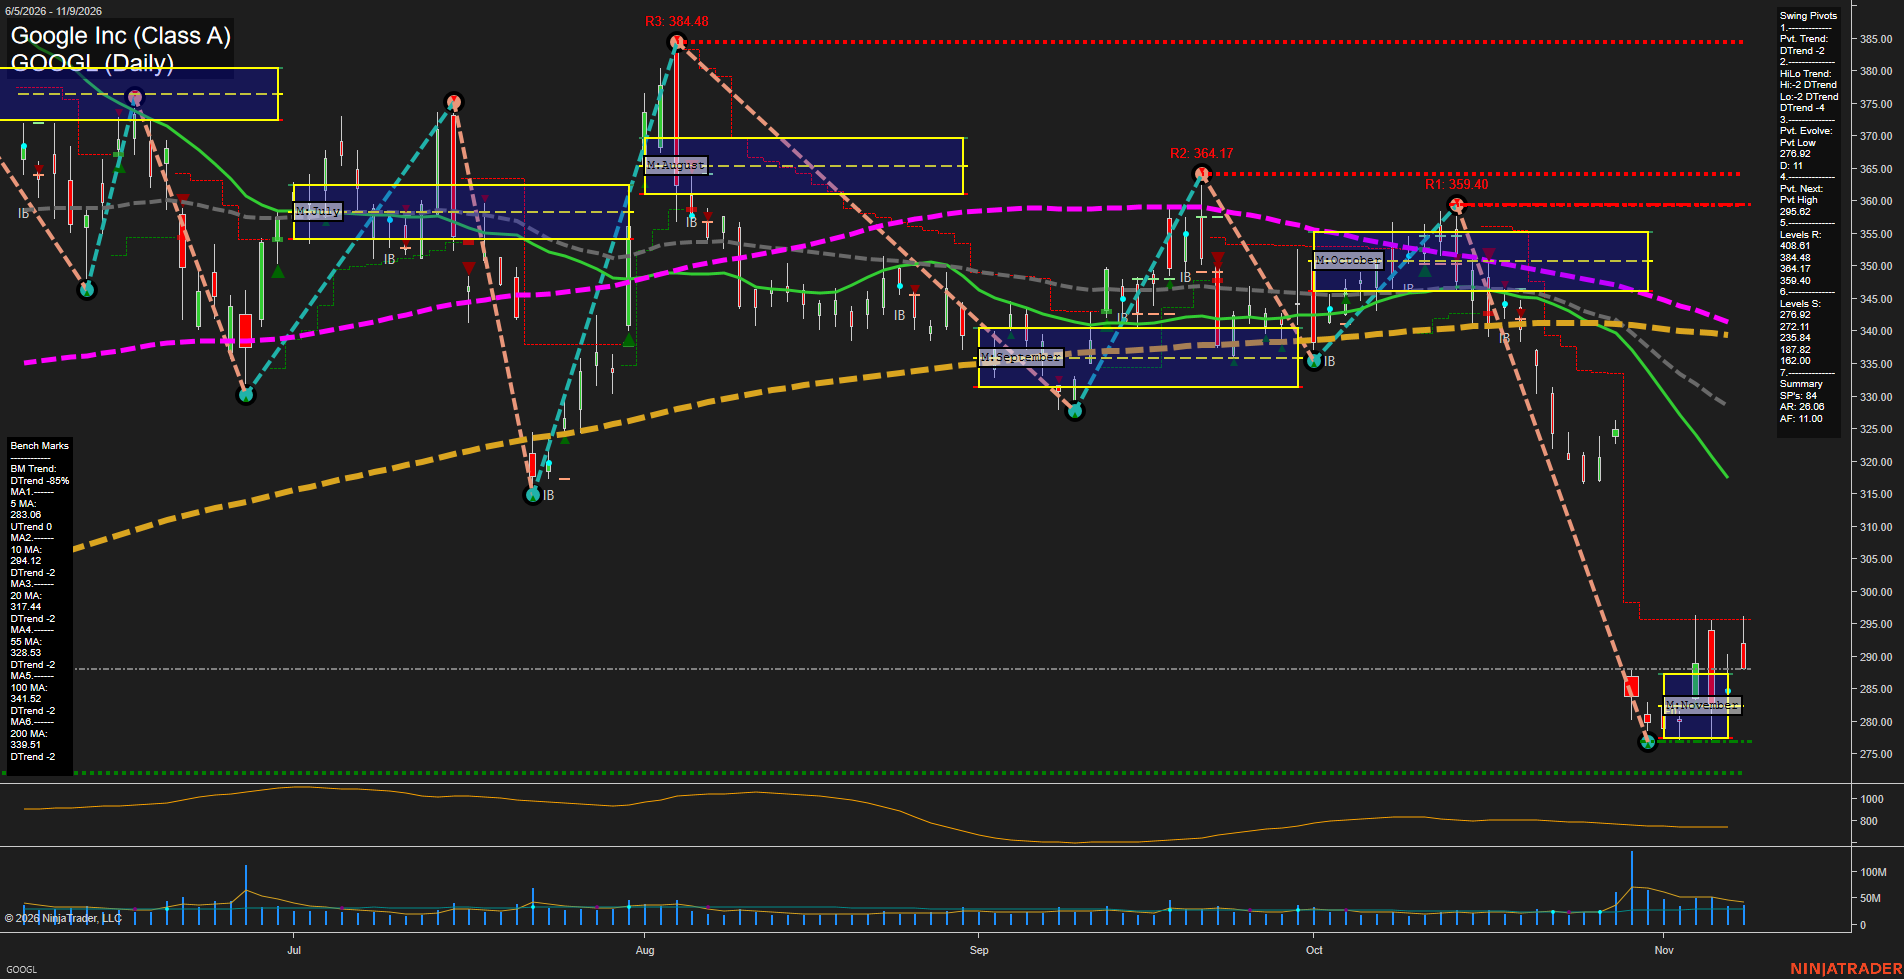
GOOGL Google Inc (Class A) Daily Chart Analysis: 2026-Nov-10 07:07 CT
Price Action
- Last: 286.00,
- Bars: Medium,
- Mom: Fast.
WSFG Weekly
- Short-Term
- WSFG Current: NA%
- F0%/NTZ' Bias: Price Neutral,
- WSFG Trend: Neutral.
MSFG Month Nov
- Intermediate-Term
- MSFG Current: 100%
- F0%/NTZ' Bias: Price Bullish,
- MSFG Trend: Neutral.
YSFG Year 2026
- Long-Term
- YSFG Current: NA%
- F0%/NTZ' Bias: Price Neutral,
- YSFG Trend: Neutral.
Swing Pivots
- (Short-Term) 1. Pvt. Trend: DTrend,
- (Intermediate-Term) 2. HiLo Trend: DTrend,
- 3. Pvt. Evolve: Pvt low 276.92,
- 4. Pvt. Next: Pvt high 295.62,
- 5. Levels R: 384.48, 364.17, 359.40,
- 6. Levels S: 276.92, 272.11, 253.84, 238.92, 167.82, 72.00.
Daily Benchmarks
- (Short-Term) 5 Day: 283.00 Up Trend,
- (Short-Term) 10 Day: 294.12 Down Trend,
- (Intermediate-Term) 20 Day: 317.44 Down Trend,
- (Intermediate-Term) 55 Day: 328.53 Down Trend,
- (Long-Term) 100 Day: 341.52 Down Trend,
- (Long-Term) 200 Day: 339.51 Down Trend.
Additional Metrics
- ATR: 420,
- VOLMA: 25379774.
Overall Rating
- Short-Term: Bearish,
- Intermediate-Term: Bearish,
- Long-Term: Bearish.
Key Insights Summary
GOOGL remains in a broad futures-style bearish swing structure, defined by a DTrend in both the active pivot and intermediate HiLo measures, lower highs from the 359.40 and 364.17 pivot-resistance region, and price beneath every benchmark except the rising 5-day average. The sharp rebound from the 276.92 pivot low has produced a short-term countertrend bounce into the November NTZ upper area, while the 295.62 next-pivot threshold remains the nearby structural reversal reference. The recent decline was fast and volatility-expanded, accompanied by elevated volume, while the rebound appears more corrective than trend-changing with the 10-, 20-, 55-, 100-, and 200-day averages all declining. Immediate structure is compressed between 276.92 support and the 295.62 pivot threshold, with the larger bearish sequence intact below the clustered 317.44 to 341.52 intermediate and long-term benchmark band.
Chart Analysis ATS AI Generated: 2026-11-10 07:08 for Informational use only, not trading advice. Terms and Risk Disclosure Copyright © 2026. Algo Trading Systems LLC.