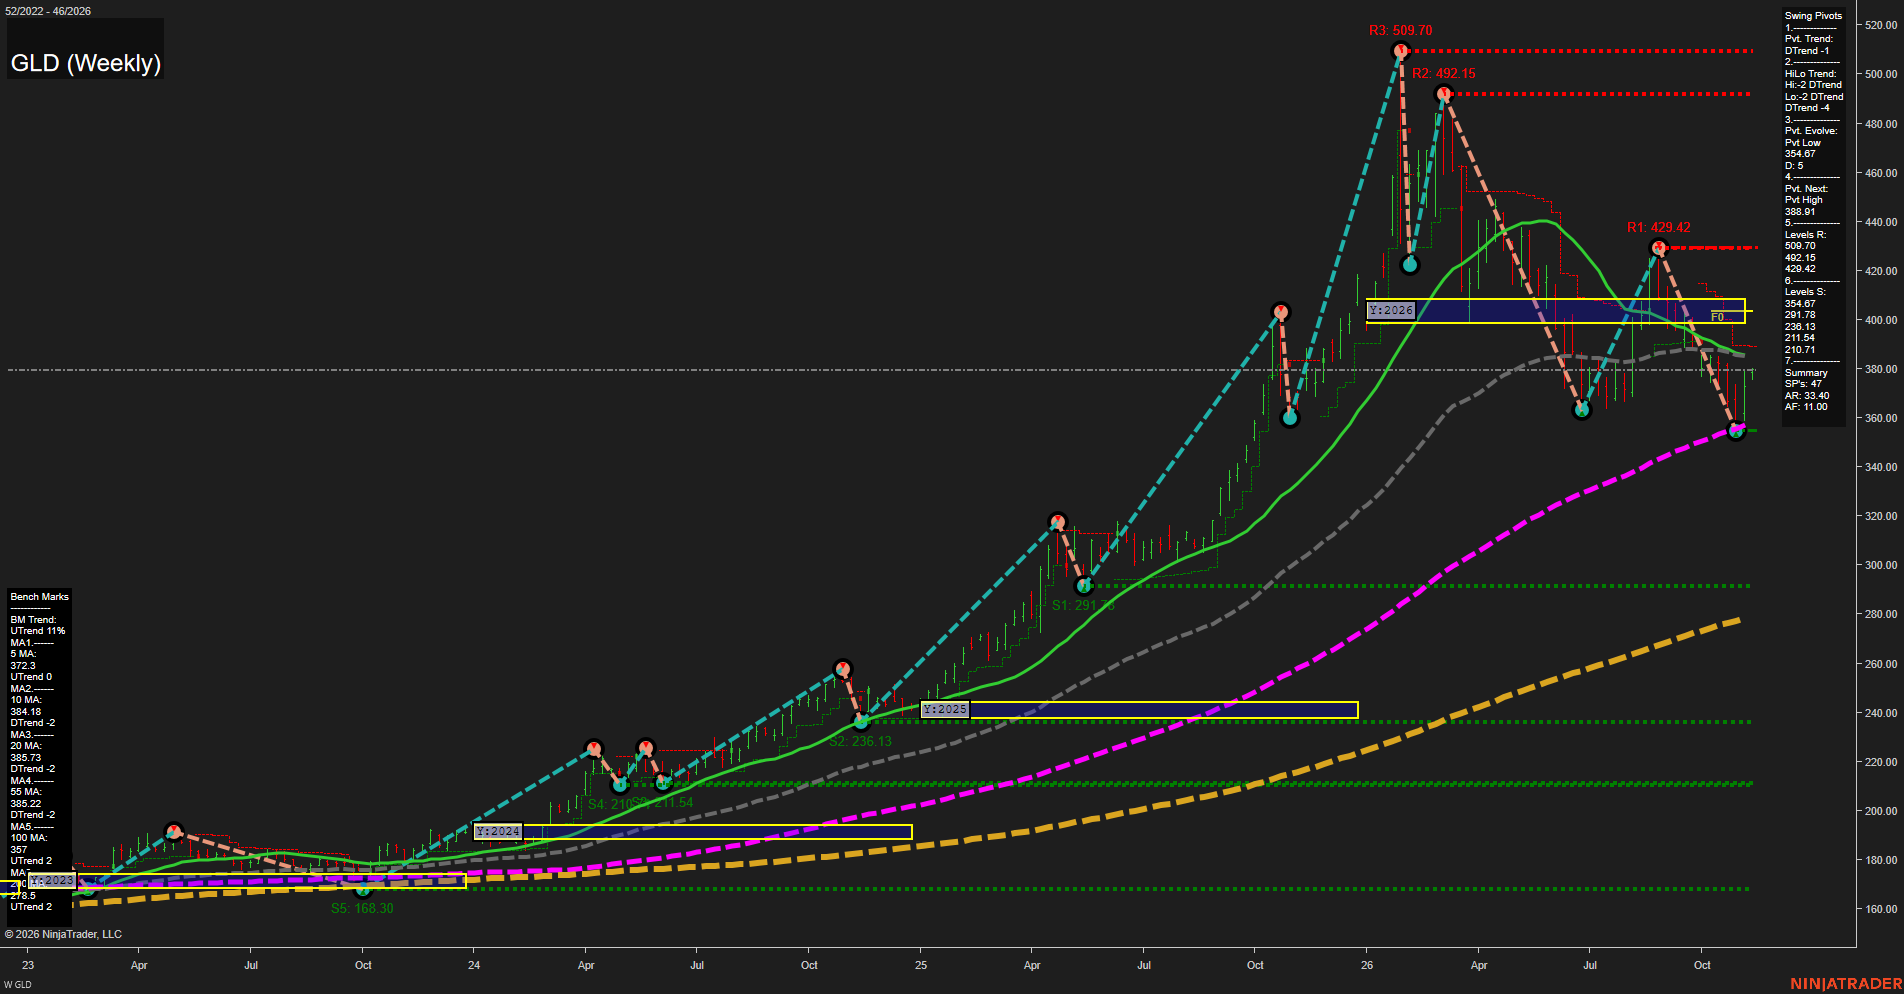
GLD SPDR Gold Shares Weekly Chart Analysis: 2026-Nov-10 07:07 CT
Price Action
- Last: 374.00,
- Bars: Large,
- Mom: fast.
WSFG Weekly
- Short-Term
- WSFG Current: NA%
- F0%/NTZ' Bias: Price Neutral,
- WSFG Trend: Neutral.
MSFG Month Nov
- Intermediate-Term
- MSFG Current: NA%
- F0%/NTZ' Bias: Price Neutral,
- MSFG Trend: Neutral.
YSFG Year 2026
- Long-Term
- YSFG Current: -6.5%
- F0%/NTZ' Bias: Price Below NTZ,
- YSFG Trend: Bearish.
Swing Pivots
- (Short-Term) 1. Pvt. Trend: DTrend,
- (Intermediate-Term) 2. HiLo Trend: DTrend,
- 3. Pvt. Evolve: Pvt low 354.67,
- 4. Pvt. Next: Pvt high 388.91,
- 5. Levels R: 509.70, 492.15, 429.42,
- 6. Levels S: 354.67, 291.78, 236.13, 211.54, 210.71.
Weekly Benchmarks
- (Short-Term) 5 Day: 372.30 Up Trend,
- (Short-Term) 10 Day: 384.18 Down Trend,
- (Intermediate-Term) 20 Day: 385.73 Down Trend,
- (Intermediate-Term) 55 Day: 385.22 Down Trend,
- (Long-Term) 100 Day: 357.00 Up Trend,
- (Long-Term) 200 Day: 278.95 Up Trend.
Overall Rating
- Short-Term: Neutral,
- Intermediate-Term: Bearish,
- Long-Term: Bullish.
Key Insights Summary
GLD is staging a fast rebound from the 354.67 pivot-low area, but the weekly swing structure remains in a DTrend with lower highs beneath 429.42 and the 388.91 pivot-confirmation level. Price is below the 10-, 20-, and 55-week benchmark cluster near 384-386 and below the 2026 yearly F0%/NTZ zone near 400, defining an intermediate-term countertrend bounce within a broader corrective phase. The long-term structure remains constructive because price holds above rising 100- and 200-week benchmarks, while 354.67 is the immediate structural support separating a rebound pattern from renewed downside continuation.
Chart Analysis ATS AI Generated: 2026-11-10 07:07 for Informational use only, not trading advice. Terms and Risk Disclosure Copyright © 2026. Algo Trading Systems LLC.