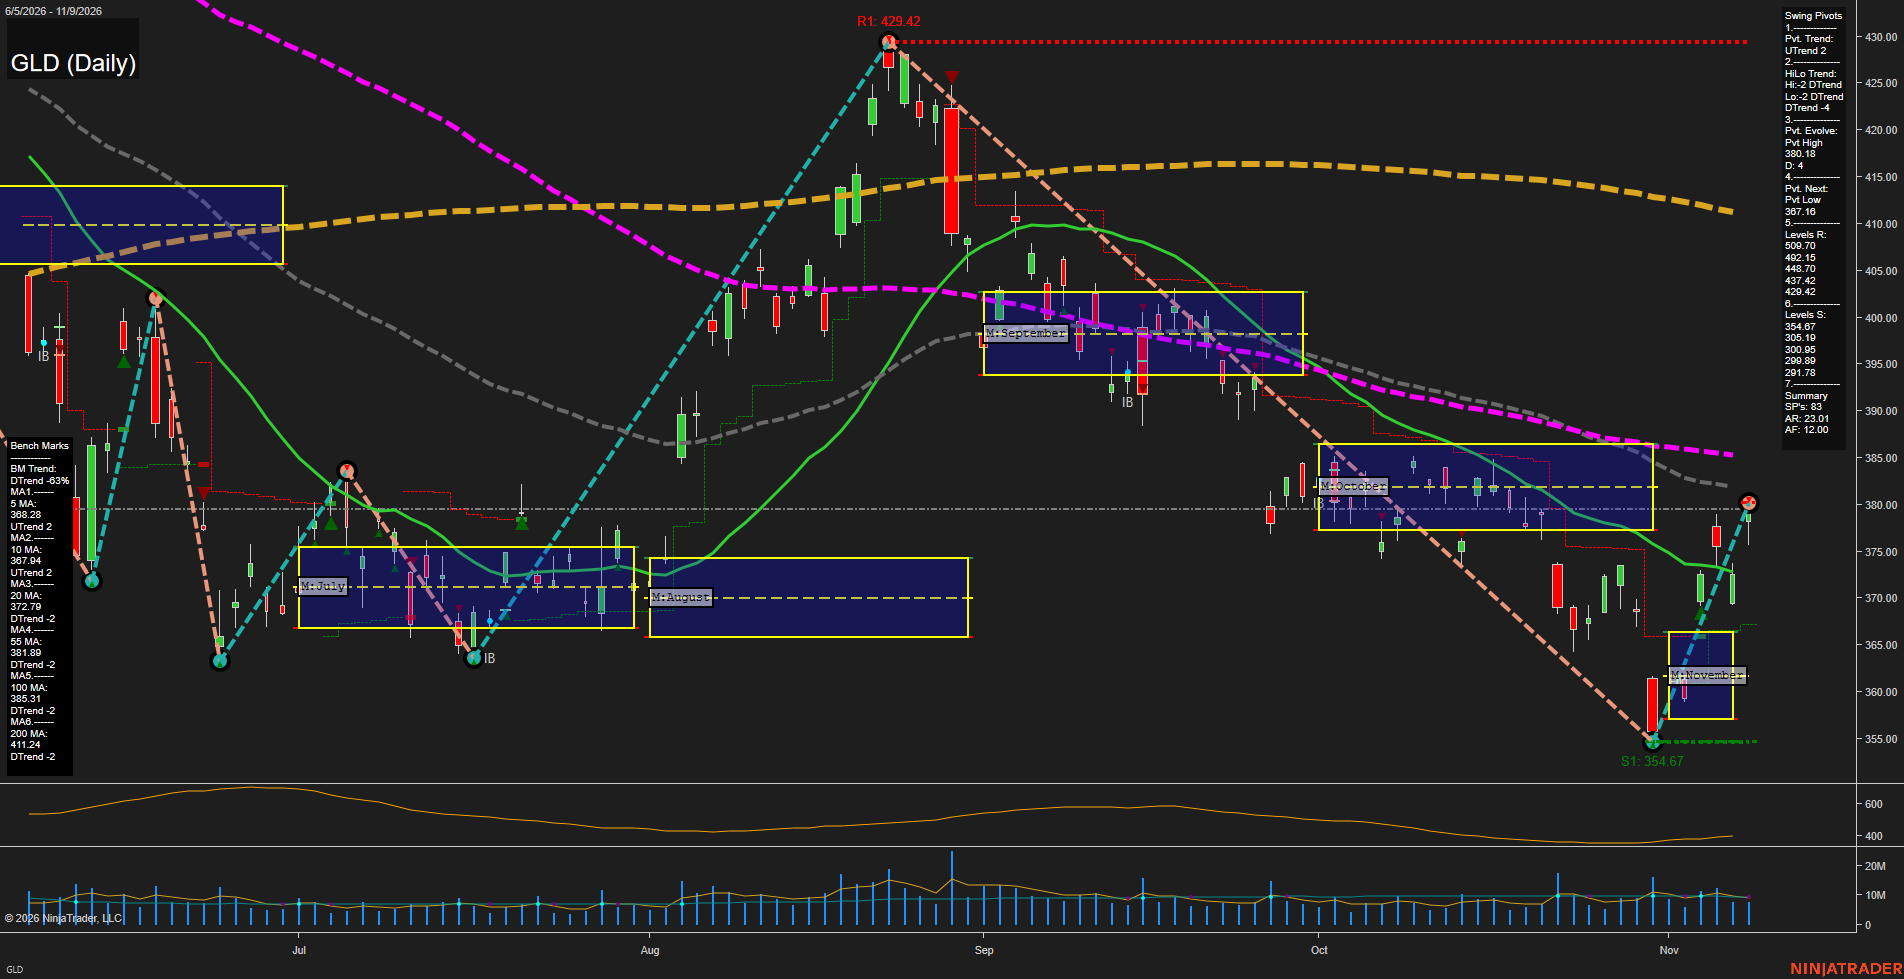
GLD SPDR Gold Shares Daily Chart Analysis: 2026-Nov-10 07:07 CT
Price Action
- Last: 380.18,
- Bars: Medium,
- Mom: Fast.
WSFG Weekly
- Short-Term
- WSFG Current: NA%
- F0%/NTZ' Bias: Price Neutral,
- WSFG Trend: Neutral.
MSFG Month Nov
- Intermediate-Term
- MSFG Current: NA%
- F0%/NTZ' Bias: Price Bullish,
- MSFG Trend: UTrend.
YSFG Year 2026
- Long-Term
- YSFG Current: NA%
- F0%/NTZ' Bias: Price Neutral,
- YSFG Trend: Neutral.
Swing Pivots
- (Short-Term) 1. Pvt. Trend: UTrend,
- (Intermediate-Term) 2. HiLo Trend: DTrend,
- 3. Pvt. Evolve: Pvt high 380.18,
- 4. Pvt. Next: Pvt low 367.16,
- 5. Levels R: 504.55, 492.15, 443.70, 429.42,
- 6. Levels S: 364.67, 305.19, 300.85, 299.89, 291.78.
Daily Benchmarks
- (Short-Term) 5 Day: 368.28 Up Trend,
- (Short-Term) 10 Day: 367.94 Up Trend,
- (Intermediate-Term) 20 Day: 372.79 Down Trend,
- (Intermediate-Term) 55 Day: 381.89 Down Trend,
- (Long-Term) 100 Day: 385.31 Down Trend,
- (Long-Term) 200 Day: 411.24 Down Trend.
Additional Metrics
- ATR: 23.01,
- VOLMA: 12.00.
Overall Rating
- Short-Term: Bullish,
- Intermediate-Term: Bearish,
- Long-Term: Bearish.
Key Insights Summary
GLD shows a fast short-term rebound from the 354.67 swing low, with price reclaiming the 5-, 10-, and 20-day benchmarks and the November NTZ upper area. From a futures swing-trader perspective, this is a countertrend recovery inside a broader intermediate and long-term decline: the 55-, 100-, and 200-day averages remain downward sloping and overhead. The current 380.18 pivot high is the immediate decision area, while 367.16 is the reversal level for the developing short-term upswing. The recovery has a sharp V-shaped character and elevated ATR, whereas the larger structure still contains lower highs from the August peak and a declining major-trend backdrop.
Chart Analysis ATS AI Generated: 2026-11-10 07:07 for Informational use only, not trading advice. Terms and Risk Disclosure Copyright © 2026. Algo Trading Systems LLC.