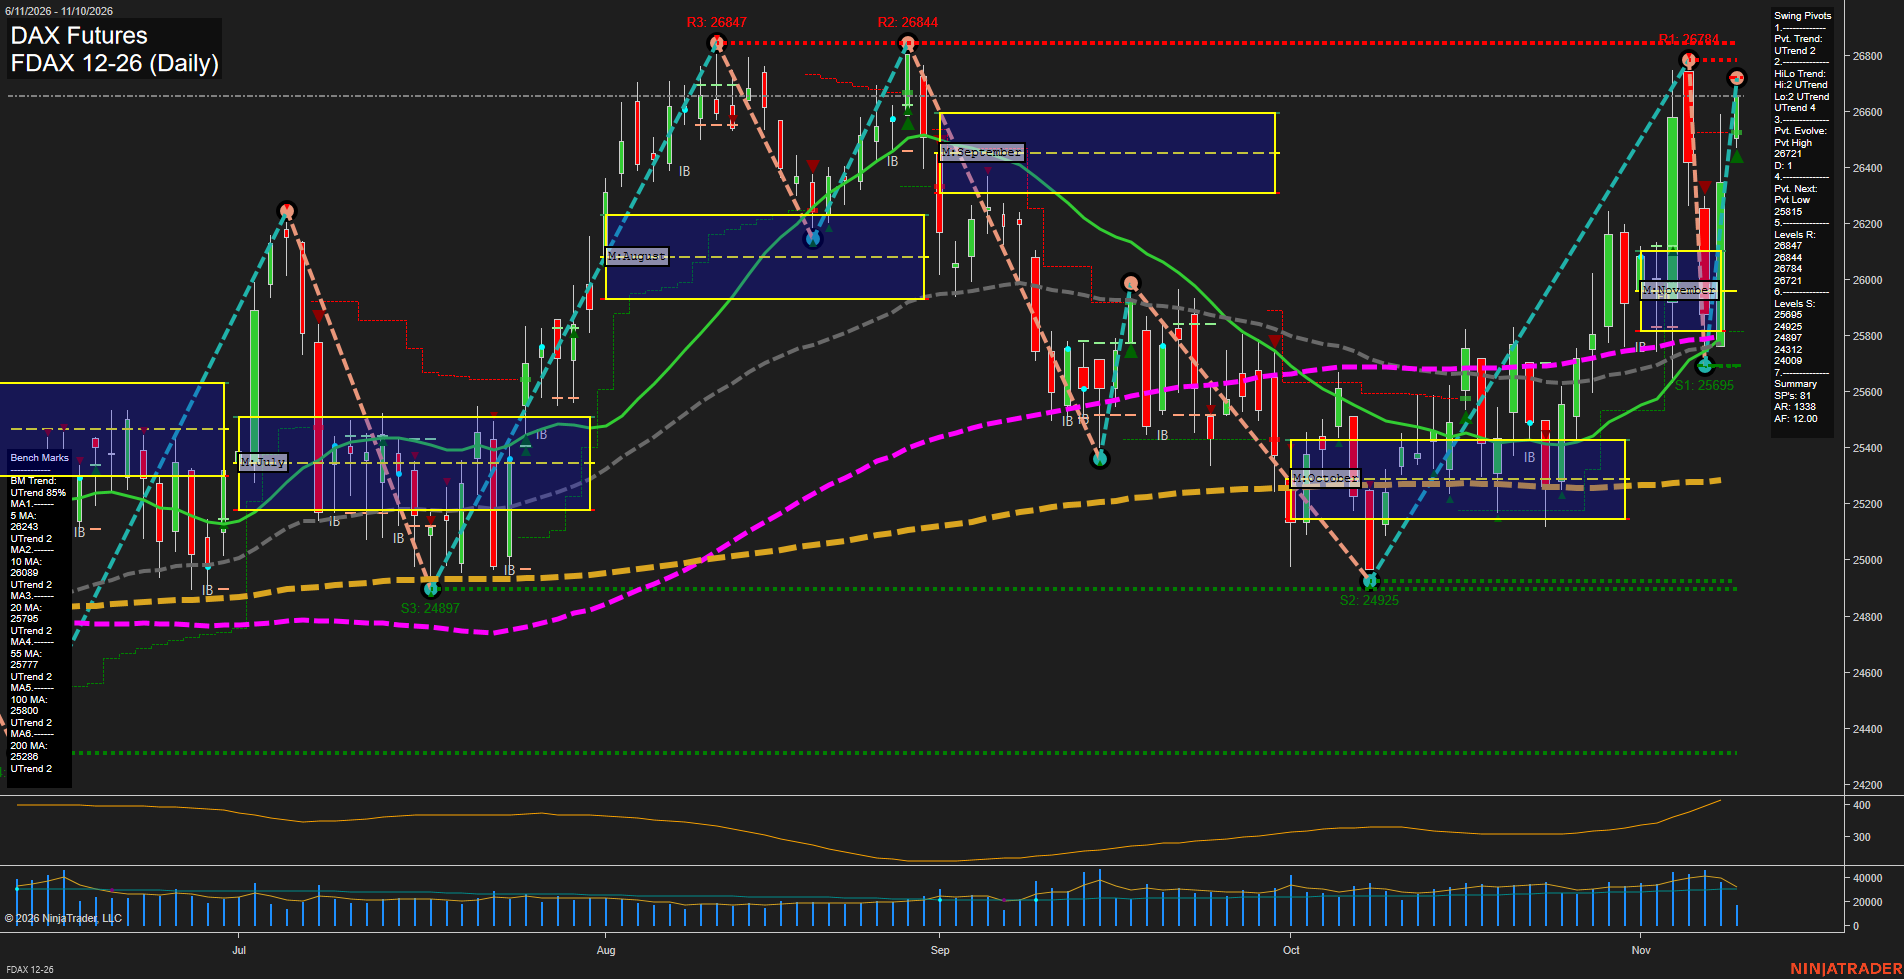
FDAX DAX Futures Daily Chart Analysis: 2026-Nov-10 07:05 CT
Price Action
- Last: 26684,
- Bars: Large,
- Mom: fast.
WSFG Weekly
- Short-Term
- WSFG Current: 107%
- F0%/NTZ' Bias: Price Above,
- WSFG Trend: Up.
MSFG Month Nov
- Intermediate-Term
- MSFG Current: 62%
- F0%/NTZ' Bias: Price Above,
- MSFG Trend: Up.
YSFG Year 2026
- Long-Term
- YSFG Current: 46%
- F0%/NTZ' Bias: Price Above,
- YSFG Trend: Up.
Swing Pivots
- (Short-Term) 1. Pvt. Trend: UTrend,
- (Intermediate-Term) 2. HiLo Trend: UTrend,
- 3. Pvt. Evolve: Pvt high 26784,
- 4. Pvt. Next: Pvt low 25815,
- 5. Levels R: 26847, 26844, 26784, 26781, 26684,
- 6. Levels S: 25895, 24925, 24897, 24312, 24009.
Daily Benchmarks
- (Short-Term) 5 Day: 26243 Up Trend,
- (Short-Term) 10 Day: 26808 Up Trend,
- (Intermediate-Term) 20 Day: 25795 Up Trend,
- (Intermediate-Term) 55 Day: 25777 Up Trend,
- (Long-Term) 100 Day: 25800 Up Trend,
- (Long-Term) 200 Day: 25288 Up Trend.
Additional Metrics
Recent Trade Signals
- 06 Nov 2026: Short FDAX 12-26 @ 25803 Signals.USAR-MSFG
- 06 Nov 2026: Short FDAX 12-26 @ 25803 Signals.USAR-WSFG
Overall Rating
- Short-Term: Bullish,
- Intermediate-Term: Bullish,
- Long-Term: Bullish.
Key Insights Summary
FDAX has produced a sharp V-shaped recovery from the early-November pullback, reclaiming the intermediate and long-term benchmark cluster near 25777-25800 and restoring both short-term pivot and intermediate HiLo trends to UTrend. Price is testing the dense 26784-26847 resistance band after large-range advancing bars, reflecting fast upside momentum and elevated volatility. The 10-day benchmark near 26808 and the nearby pivot highs define a narrow overhead consolidation zone, while 25895 is the nearest meaningful swing support and 25815 is the reversal threshold for the current pivot structure. The broader structure remains constructive, with price above the weekly, monthly, and yearly Fib-grid centers and all displayed benchmark trends rising.
Chart Analysis ATS AI Generated: 2026-11-10 07:05 for Informational use only, not trading advice. Terms and Risk Disclosure Copyright © 2026. Algo Trading Systems LLC.