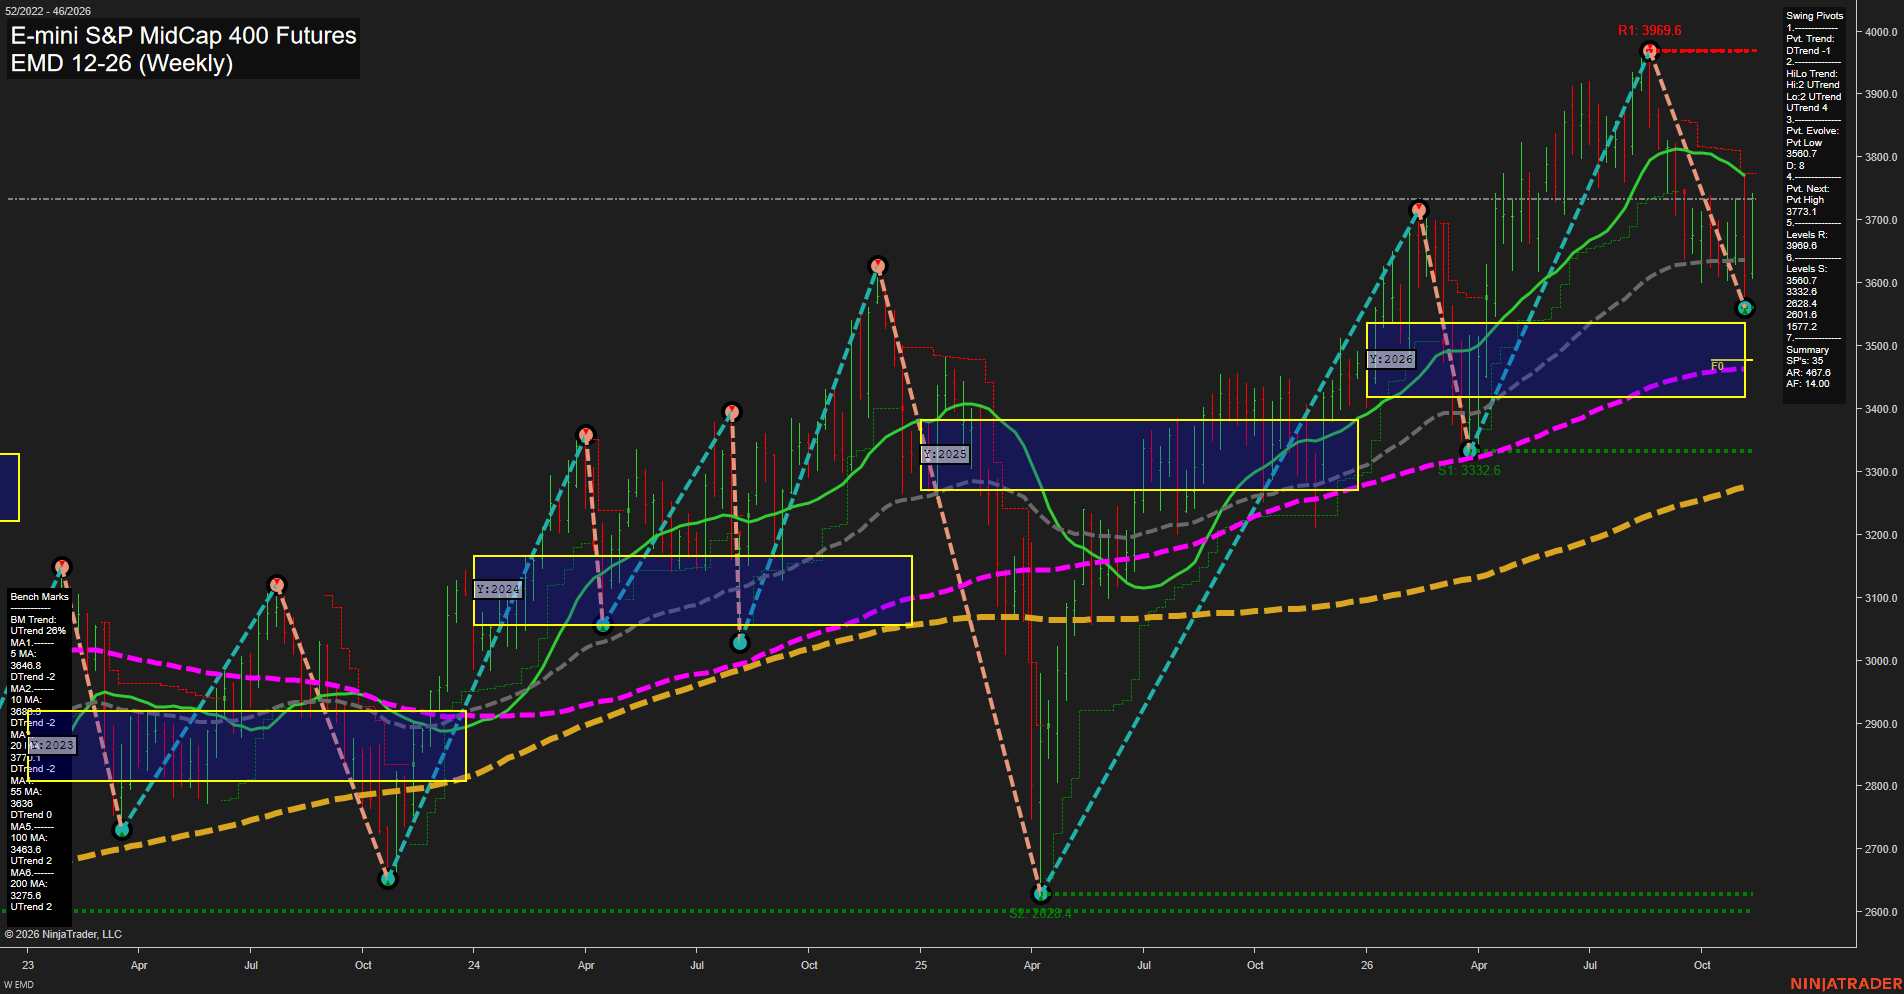
EMD E-mini S&P MidCap 400 Futures Weekly Chart Analysis: 2026-Nov-10 07:04 CT
Price Action
- Last: 3731.1,
- Bars: Large,
- Mom: fast.
WSFG Weekly
- Short-Term
- WSFG Current: 98%
- F0%/NTZ' Bias: Price Above,
- WSFG Trend: Up.
MSFG Month Nov
- Intermediate-Term
- MSFG Current: 37%
- F0%/NTZ' Bias: Price Above,
- MSFG Trend: Up.
YSFG Year 2026
- Long-Term
- YSFG Current: 43%
- F0%/NTZ' Bias: Price Above,
- YSFG Trend: Up.
Swing Pivots
- (Short-Term) 1. Pvt. Trend: DTrend,
- (Intermediate-Term) 2. HiLo Trend: UTrend,
- 3. Pvt. Evolve: Pvt low 3560.7,
- 4. Pvt. Next: Pvt high 3773.1,
- 5. Levels R: 3996.6,
- 6. Levels S: 3560.7, 3332.6, 2628.4, 2601.6, 1577.2.
Weekly Benchmarks
- (Short-Term) 5 Day: 3648.6 Down Trend,
- (Short-Term) 10 Day: 3689.6 Down Trend,
- (Intermediate-Term) 20 Day: 3777.1 Down Trend,
- (Intermediate-Term) 55 Day: 3636.7 Up Trend,
- (Long-Term) 100 Day: 3463.6 Up Trend,
- (Long-Term) 200 Day: 3275.6 Up Trend.
Recent Trade Signals
- 09 Nov 2026: Long EMD 12-26 @ 3625 Signals.USAR-WSFG
- 03 Nov 2026: Long EMD 12-26 @ 3702.5 Signals.USAR-MSFG
Overall Rating
- Short-Term: Neutral,
- Intermediate-Term: Bullish,
- Long-Term: Bullish.
Key Insights Summary
Price is rebounding sharply from the 3560.7 swing-low area and remains above the weekly, monthly, and yearly Fib-grid centers, preserving the broader bullish structure. The immediate pivot trend remains down following the decline from 3996.6, while the intermediate HiLo trend remains up and price is rebuilding above the 55-, 100-, and 200-period benchmarks. The current advance has fast momentum and large weekly ranges, with 3773.1 defining the nearby pivot-reversal threshold and 3996.6 the major overhead swing resistance. The 3560.7 level is the nearest structural support, followed by 3332.6; the long-term benchmark alignment continues to show higher-timeframe trend strength despite the short-term corrective pivot condition.
Chart Analysis ATS AI Generated: 2026-11-10 07:04 for Informational use only, not trading advice. Terms and Risk Disclosure Copyright © 2026. Algo Trading Systems LLC.