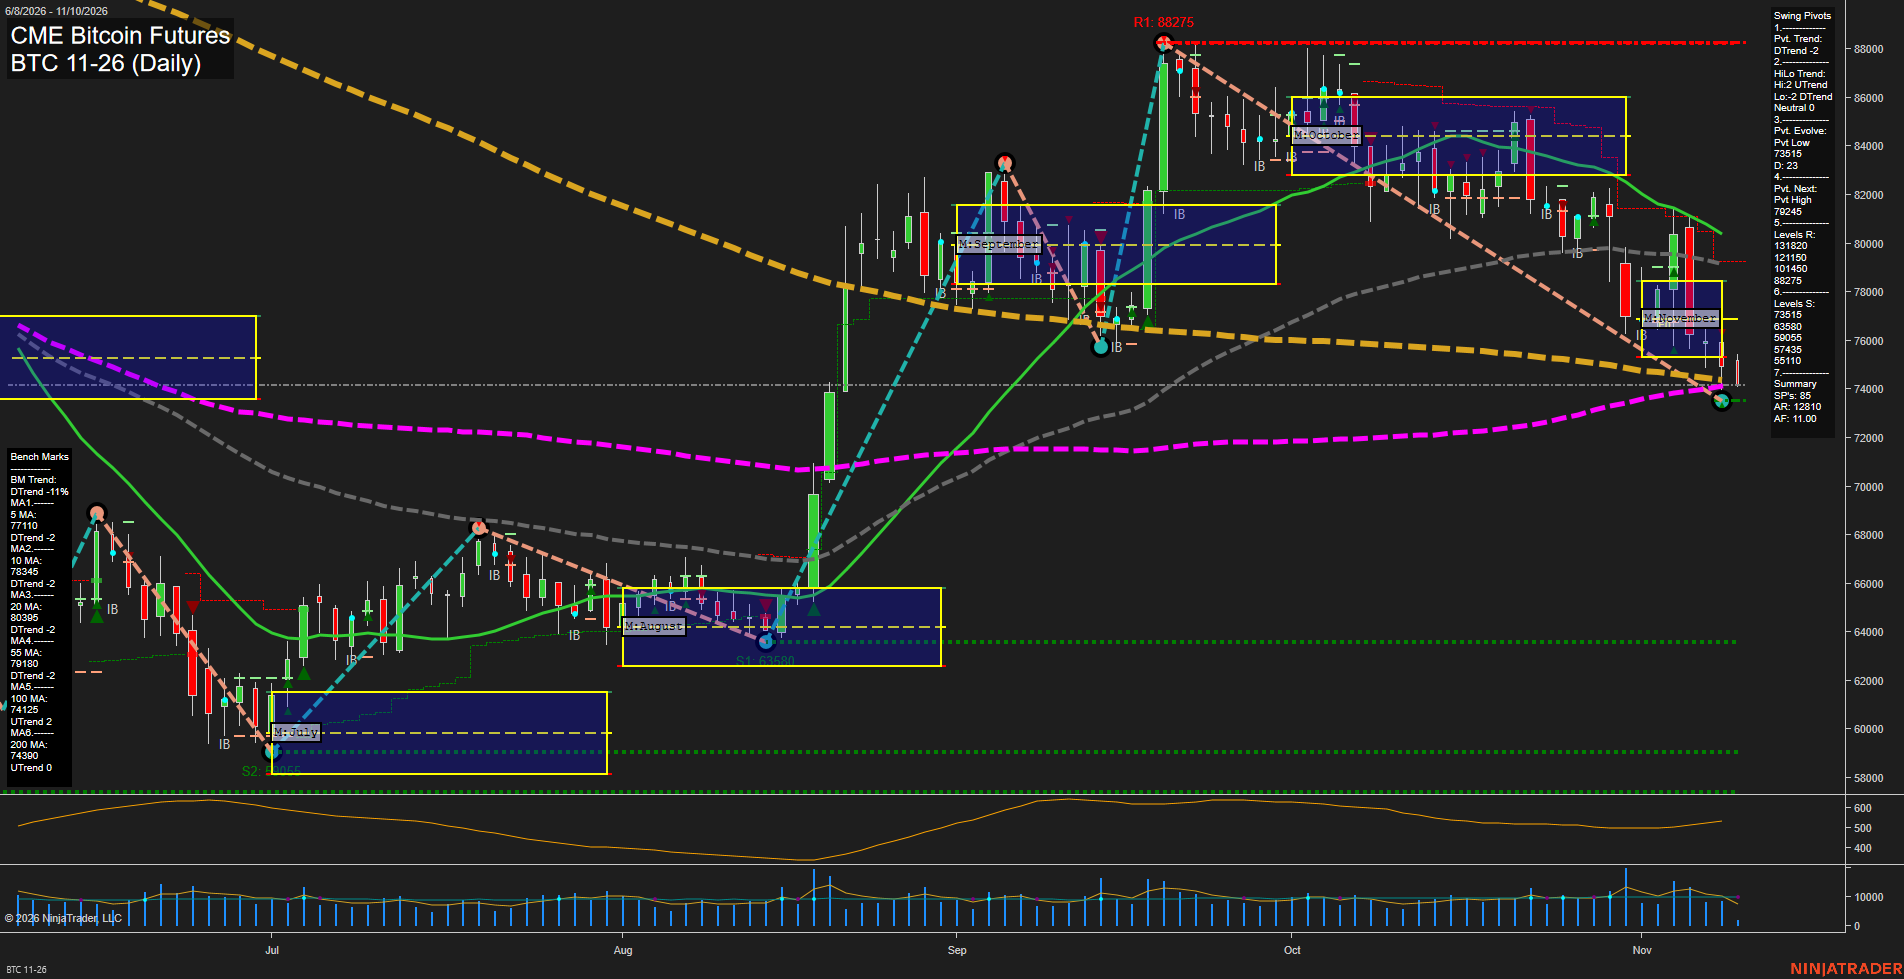
BTC CME Bitcoin Futures Daily Chart Analysis: 2026-Nov-10 07:02 CT
Price Action
- Last: 74120,
- Bars: Medium,
- Mom: fast.
WSFG Weekly
- Short-Term
- WSFG Current: -30%
- F0%/NTZ' Bias: Price Below,
- WSFG Trend: Down.
MSFG Month Nov
- Intermediate-Term
- MSFG Current: -24%
- F0%/NTZ' Bias: Price Below,
- MSFG Trend: Down.
YSFG Year 2026
- Long-Term
- YSFG Current: -59%
- F0%/NTZ' Bias: Price Below,
- YSFG Trend: Down.
Swing Pivots
- (Short-Term) 1. Pvt. Trend: DTrend,
- (Intermediate-Term) 2. HiLo Trend: UTrend,
- 3. Pvt. Evolve: Pvt low 73550,
- 4. Pvt. Next: Pvt high 79245,
- 5. Levels R: 88275, 83131, 82150, 80145,
- 6. Levels S: 73550, 63580, 59055, 57435, 55110.
Daily Benchmarks
- (Short-Term) 5 Day: 77110 Down Trend,
- (Short-Term) 10 Day: 78349 Down Trend,
- (Intermediate-Term) 20 Day: 80395 Down Trend,
- (Intermediate-Term) 55 Day: 79185 Down Trend,
- (Long-Term) 100 Day: 74125 Up Trend,
- (Long-Term) 200 Day: 74390 UTrend.
Additional Metrics
Recent Trade Signals
- 09 Nov 2026: Short BTC 11-26 @ 74740 Signals.USAR-MSFG
- 04 Nov 2026: Long BTC 11-26 @ 78690 Signals.USAR-WSFG
Overall Rating
- Short-Term: Bearish,
- Intermediate-Term: Bearish,
- Long-Term: Neutral.
Key Insights Summary
Price has completed a sharp decline from the October 88275 pivot high and remains below the weekly and monthly Fib-grid centers, all short- and intermediate-term daily benchmarks, and the 79245 next-pivot threshold. The active short-term pivot structure is bearish, with lower highs defining the decline, while the intermediate HiLo structure remains upward because the broader advance from the summer lows has not been fully invalidated. The 73550 pivot low is the immediate downside reference, while 74125-74390 clusters the rising 100- and 200-day benchmarks near current price. Recent bars reflect an oversold bounce attempt around long-term moving-average support, but the broader swing character remains a corrective selloff unless price reclaims the 77110-78349 short-term benchmark zone and subsequently the 79245 pivot level.
Chart Analysis ATS AI Generated: 2026-11-10 07:03 for Informational use only, not trading advice. Terms and Risk Disclosure Copyright © 2026. Algo Trading Systems LLC.