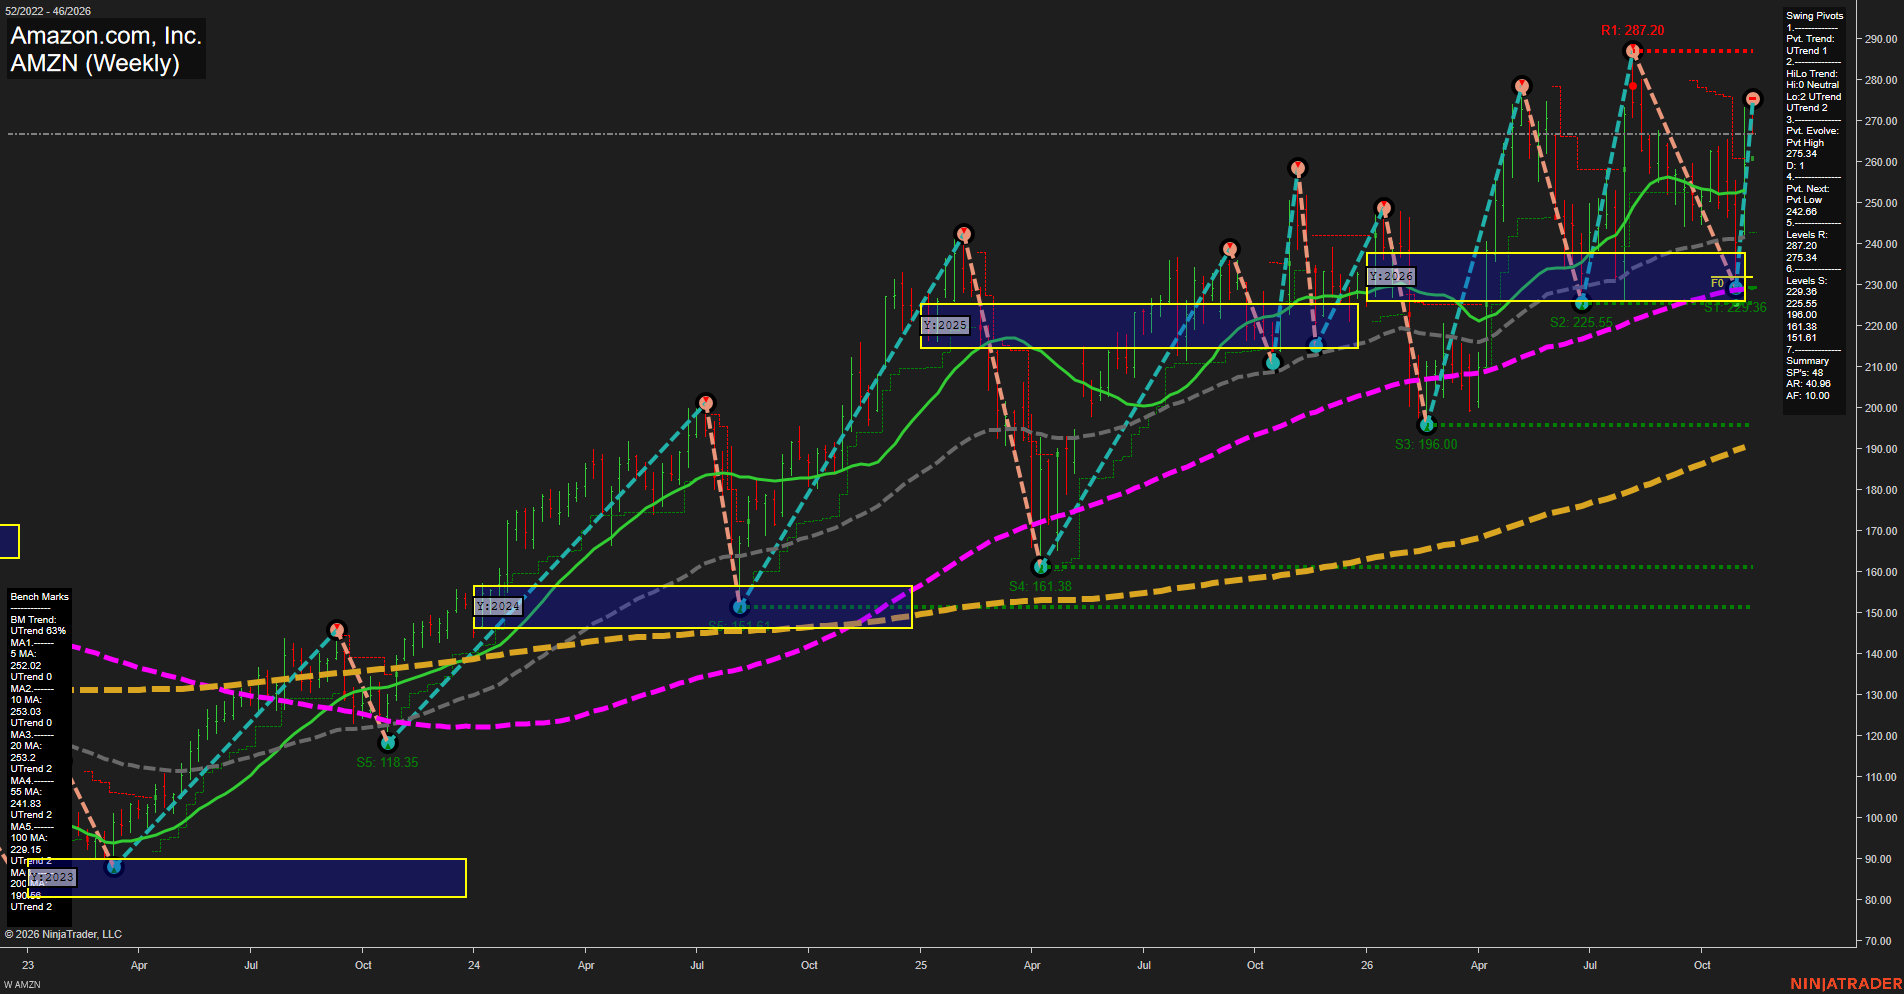
AMZN Amazon.com; Inc. Weekly Chart Analysis: 2026-Nov-10 07:02 CT
Price Action
- Last: 267.20,
- Bars: Large,
- Mom: fast.
WSFG Weekly
- Short-Term
- WSFG Current: NA%
- F0%/NTZ' Bias: Price Bullish,
- WSFG Trend: UTrend.
MSFG Month Nov
- Intermediate-Term
- MSFG Current: NA%
- F0%/NTZ' Bias: Price Bullish,
- MSFG Trend: UTrend.
YSFG Year 2026
- Long-Term
- YSFG Current: NA%
- F0%/NTZ' Bias: Price Bullish,
- YSFG Trend: UTrend.
Swing Pivots
- (Short-Term) 1. Pvt. Trend: UTrend,
- (Intermediate-Term) 2. HiLo Trend: UTrend,
- 3. Pvt. Evolve: Pvt high 275.34,
- 4. Pvt. Next: Pvt low 242.08,
- 5. Levels R: 287.20, 275.34,
- 6. Levels S: 229.36, 225.55, 196.00, 161.38, 151.61, 118.35.
Weekly Benchmarks
- (Short-Term) 5 Day: 252.02 Up Trend,
- (Short-Term) 10 Day: 253.03 Up Trend,
- (Intermediate-Term) 20 Day: 253.25 Up Trend,
- (Intermediate-Term) 55 Day: 241.83 Up Trend,
- (Long-Term) 100 Day: 229.15 Up Trend,
- (Long-Term) 200 Day: 180.68 Up Trend.
Overall Rating
- Short-Term: Bullish,
- Intermediate-Term: Bullish,
- Long-Term: Bullish.
Key Insights Summary
AMZN futures-equivalent weekly structure remains broadly constructive: price has rebounded sharply from the 225.55 to 229.36 support area and is trading above every benchmark average. The current pivot sequence is an UTrend, with the active swing high at 275.34 defining the nearer overhead pivot barrier and 287.20 marking the larger resistance objective. Momentum is fast and weekly bars are large, reflecting elevated two-way volatility following the V-shaped recovery. The 242.08 pivot-low reversal level is the key short-term structural reference, while the 229.36 to 225.55 zone is the more important intermediate support shelf. Long-term trend alignment remains positive because the 20, 55, 100, and 200-period benchmarks are all rising and stacked below price.
Chart Analysis ATS AI Generated: 2026-11-10 07:02 for Informational use only, not trading advice. Terms and Risk Disclosure Copyright © 2026. Algo Trading Systems LLC.