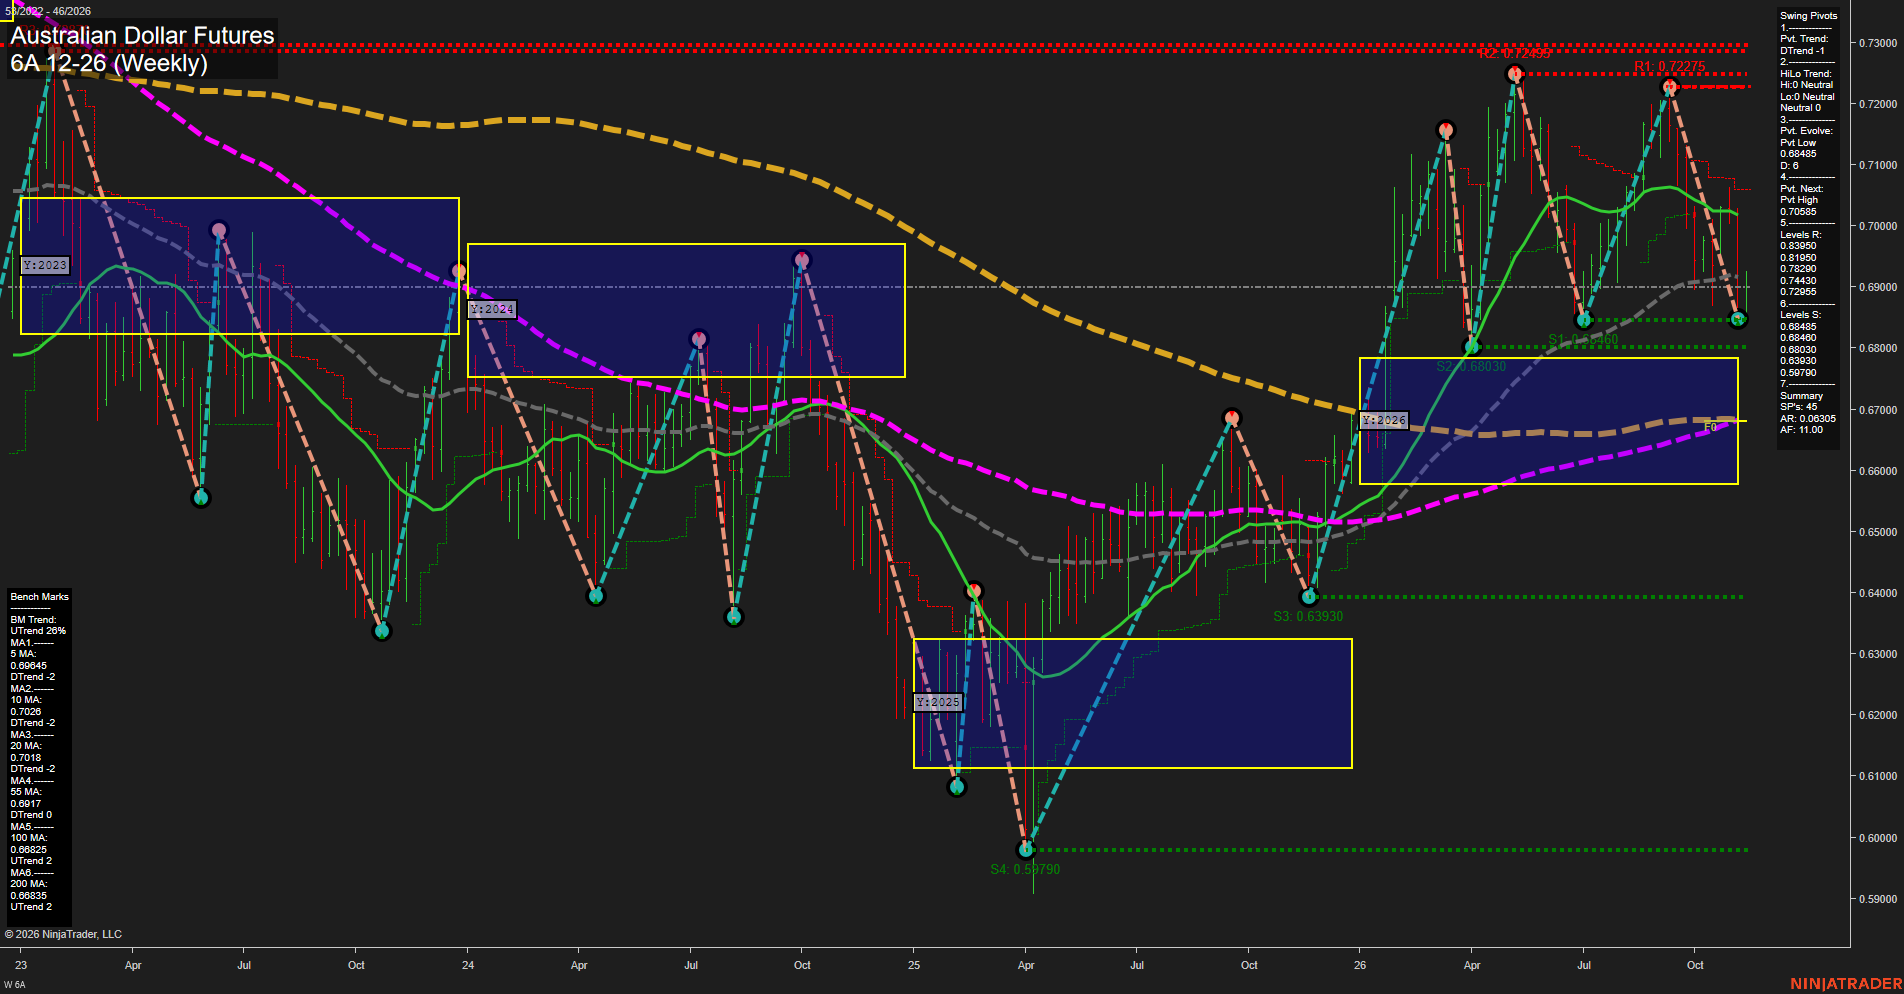
6A Australian Dollar Futures Weekly Chart Analysis: 2026-Nov-10 07:00 CT
Price Action
- Last: 0.68485,
- Bars: Medium,
- Mom: Fast.
WSFG Weekly
- Short-Term
- WSFG Current: 41%
- F0%/NTZ' Bias: Price Above,
- WSFG Trend: Up.
MSFG Month Nov
- Intermediate-Term
- MSFG Current: -54%
- F0%/NTZ' Bias: Price Below,
- MSFG Trend: Down.
YSFG Year 2026
- Long-Term
- YSFG Current: 21%
- F0%/NTZ' Bias: Price Above,
- YSFG Trend: Up.
Swing Pivots
- (Short-Term) 1. Pvt. Trend: DTrend,
- (Intermediate-Term) 2. HiLo Trend: Neutral,
- 3. Pvt. Evolve: Pvt low 0.68485,
- 4. Pvt. Next: Pvt high 0.70585,
- 5. Levels R: 0.83950, 0.81950, 0.78290, 0.74955,
- 6. Levels S: 0.68485, 0.68460, 0.68030, 0.63970.
Weekly Benchmarks
- (Short-Term) 5 Day: 0.69645 Down Trend,
- (Short-Term) 10 Day: 0.70260 Down Trend,
- (Intermediate-Term) 20 Day: 0.70180 Down Trend,
- (Intermediate-Term) 55 Day: 0.69170 Down Trend,
- (Long-Term) 100 Day: 0.66825 Down Trend,
- (Long-Term) 200 Day: 0.68635 Up Trend.
Recent Trade Signals
- 09 Nov 2026: Long 6A 12-26 @ 0.69065 Signals.USAR.TR120
- 02 Nov 2026: Short 6A 12-26 @ 0.699 Signals.USAR-MSFG
- 02 Nov 2026: Short 6A 12-26 @ 0.70035 Signals.USAR-WSFG
Overall Rating
- Short-Term: Bearish,
- Intermediate-Term: Bearish,
- Long-Term: Bullish.
Key Insights Summary
The weekly chart shows a sharp counter-trend decline from the October swing high near 0.72275, with price now testing the 0.68485 pivot-low area. Short-term pivot structure and the 5-, 10-, and 20-period benchmarks are bearish, while price remains beneath the 55-period average. The weekly fib grid remains positive above its F0% level, but monthly structure is negative and reflects an intermediate corrective phase. The yearly grid remains constructive above F0%, supported by the rising 200-period benchmark and the larger 2026 recovery from the April low. The immediate swing condition is compressed around clustered support at 0.68485, 0.68460, and 0.68030, while 0.70585 defines the next upside pivot reversal level.
Chart Analysis ATS AI Generated: 2026-11-10 07:00 for Informational use only, not trading advice. Terms and Risk Disclosure Copyright © 2026. Algo Trading Systems LLC.