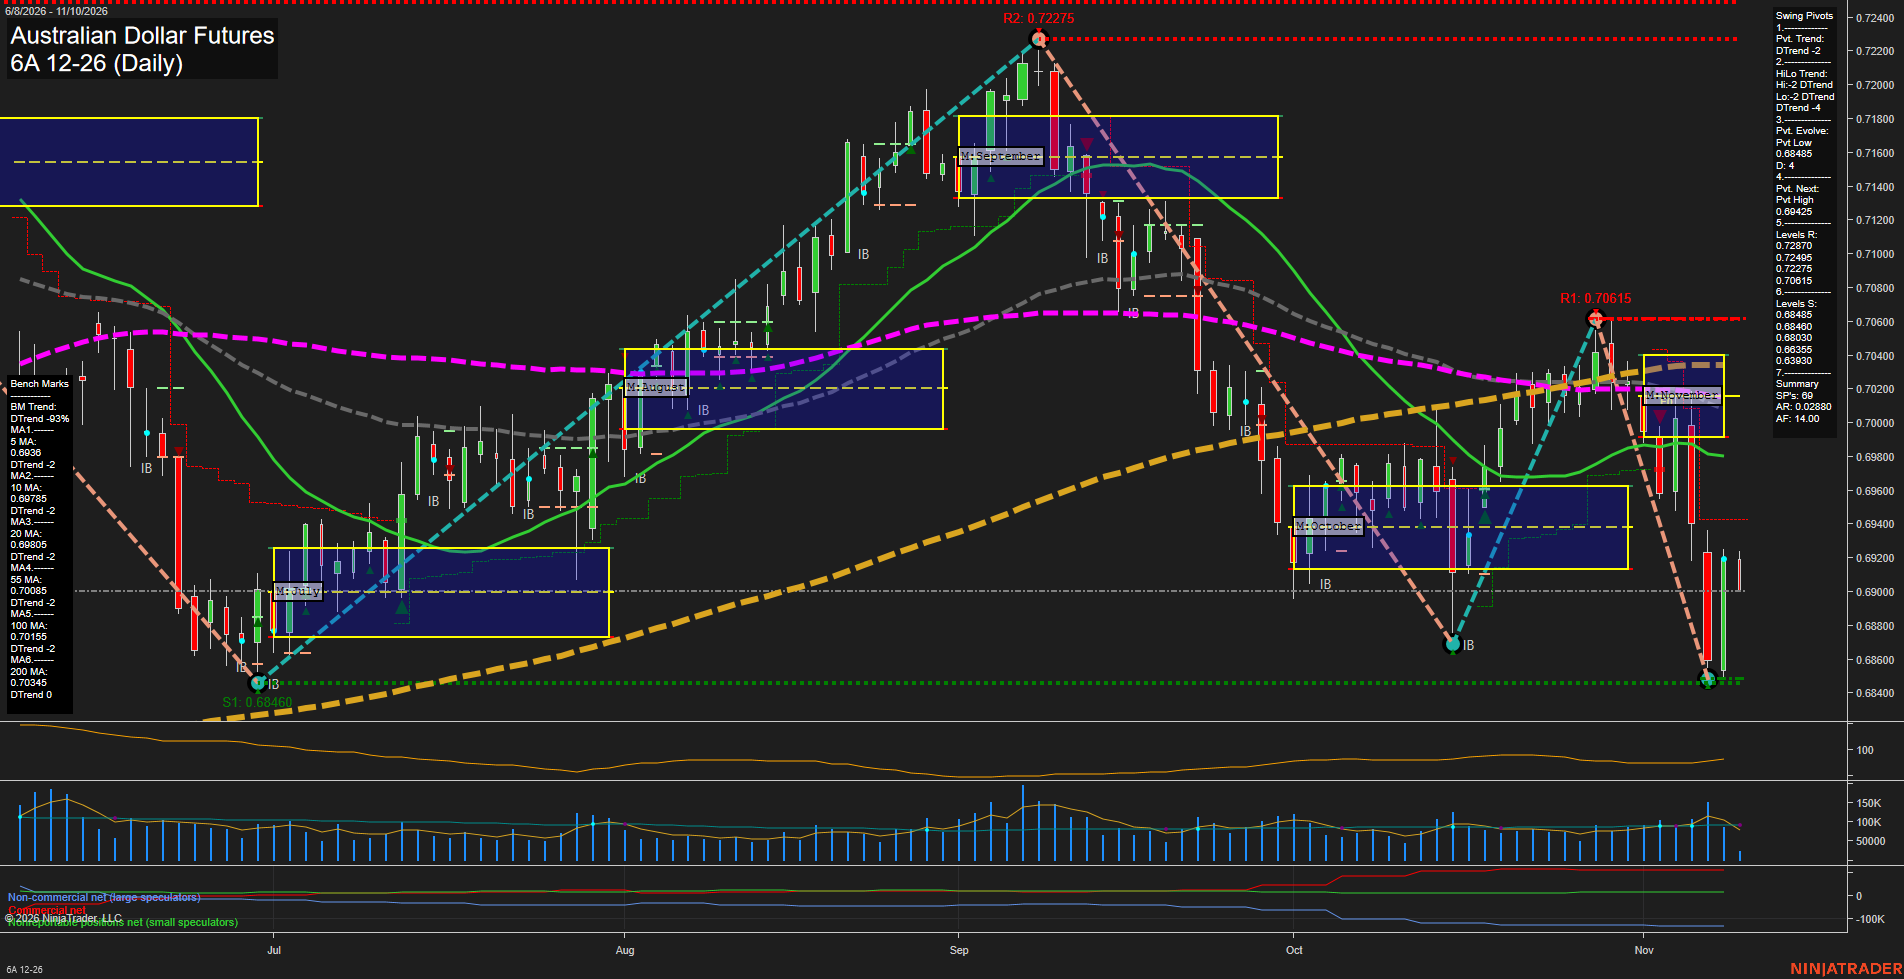
6A Australian Dollar Futures Daily Chart Analysis: 2026-Nov-10 07:00 CT
Price Action
- Last: 0.69080,
- Bars: Small,
- Mom: fast.
WSFG Weekly
- Short-Term
- WSFG Current: 41%
- F0%/NTZ' Bias: Price Above,
- WSFG Trend: Up.
MSFG Month Nov
- Intermediate-Term
- MSFG Current: -54%
- F0%/NTZ' Bias: Price Below,
- MSFG Trend: Down.
YSFG Year 2026
- Long-Term
- YSFG Current: 21%
- F0%/NTZ' Bias: Price Above,
- YSFG Trend: Up.
Swing Pivots
- (Short-Term) 1. Pvt. Trend: DTrend,
- (Intermediate-Term) 2. HiLo Trend: DTrend,
- 3. Pvt. Evolve: Pvt low 0.68435,
- 4. Pvt. Next: Pvt high 0.69425,
- 5. Levels R: 0.72870, 0.72495, 0.72275, 0.70615,
- 6. Levels S: 0.68485, 0.68460, 0.68355, 0.68330.
Daily Benchmarks
- (Short-Term) 5 Day: 0.69380 Down Trend,
- (Short-Term) 10 Day: 0.69785 Down Trend,
- (Intermediate-Term) 20 Day: 0.69805 Down Trend,
- (Intermediate-Term) 55 Day: 0.70085 Down Trend,
- (Long-Term) 100 Day: 0.70455 Down Trend,
- (Long-Term) 200 Day: 0.70345 Down Trend.
Additional Metrics
Recent Trade Signals
- 09 Nov 2026: Long 6A 12-26 @ 0.69065 Signals.USAR.TR120
- 02 Nov 2026: Short 6A 12-26 @ 0.699 Signals.USAR-MSFG
- 02 Nov 2026: Short 6A 12-26 @ 0.70035 Signals.USAR-WSFG
Overall Rating
- Short-Term: Bearish,
- Intermediate-Term: Bearish,
- Long-Term: Neutral.
Key Insights Summary
The daily structure remains bearish from a swing-trader perspective: both pivot trends are down, price is beneath every benchmark average, and the November monthly grid remains below its F0% centerline. The market produced a sharp selloff from the early-November 0.70615 pivot high into the 0.68435 low, followed by a fast but still incomplete rebound toward 0.69080. The latest small bar reflects consolidation after high-velocity downside movement. The 0.69425 pivot-next level defines the nearby upside structural threshold, while the 0.68485 to 0.68330 support cluster remains the active lower swing area. Weekly and yearly grids retain an upward bias, creating a countertrend backdrop against the prevailing daily and intermediate-term decline.
Chart Analysis ATS AI Generated: 2026-11-10 07:00 for Informational use only, not trading advice. Terms and Risk Disclosure Copyright © 2026. Algo Trading Systems LLC.