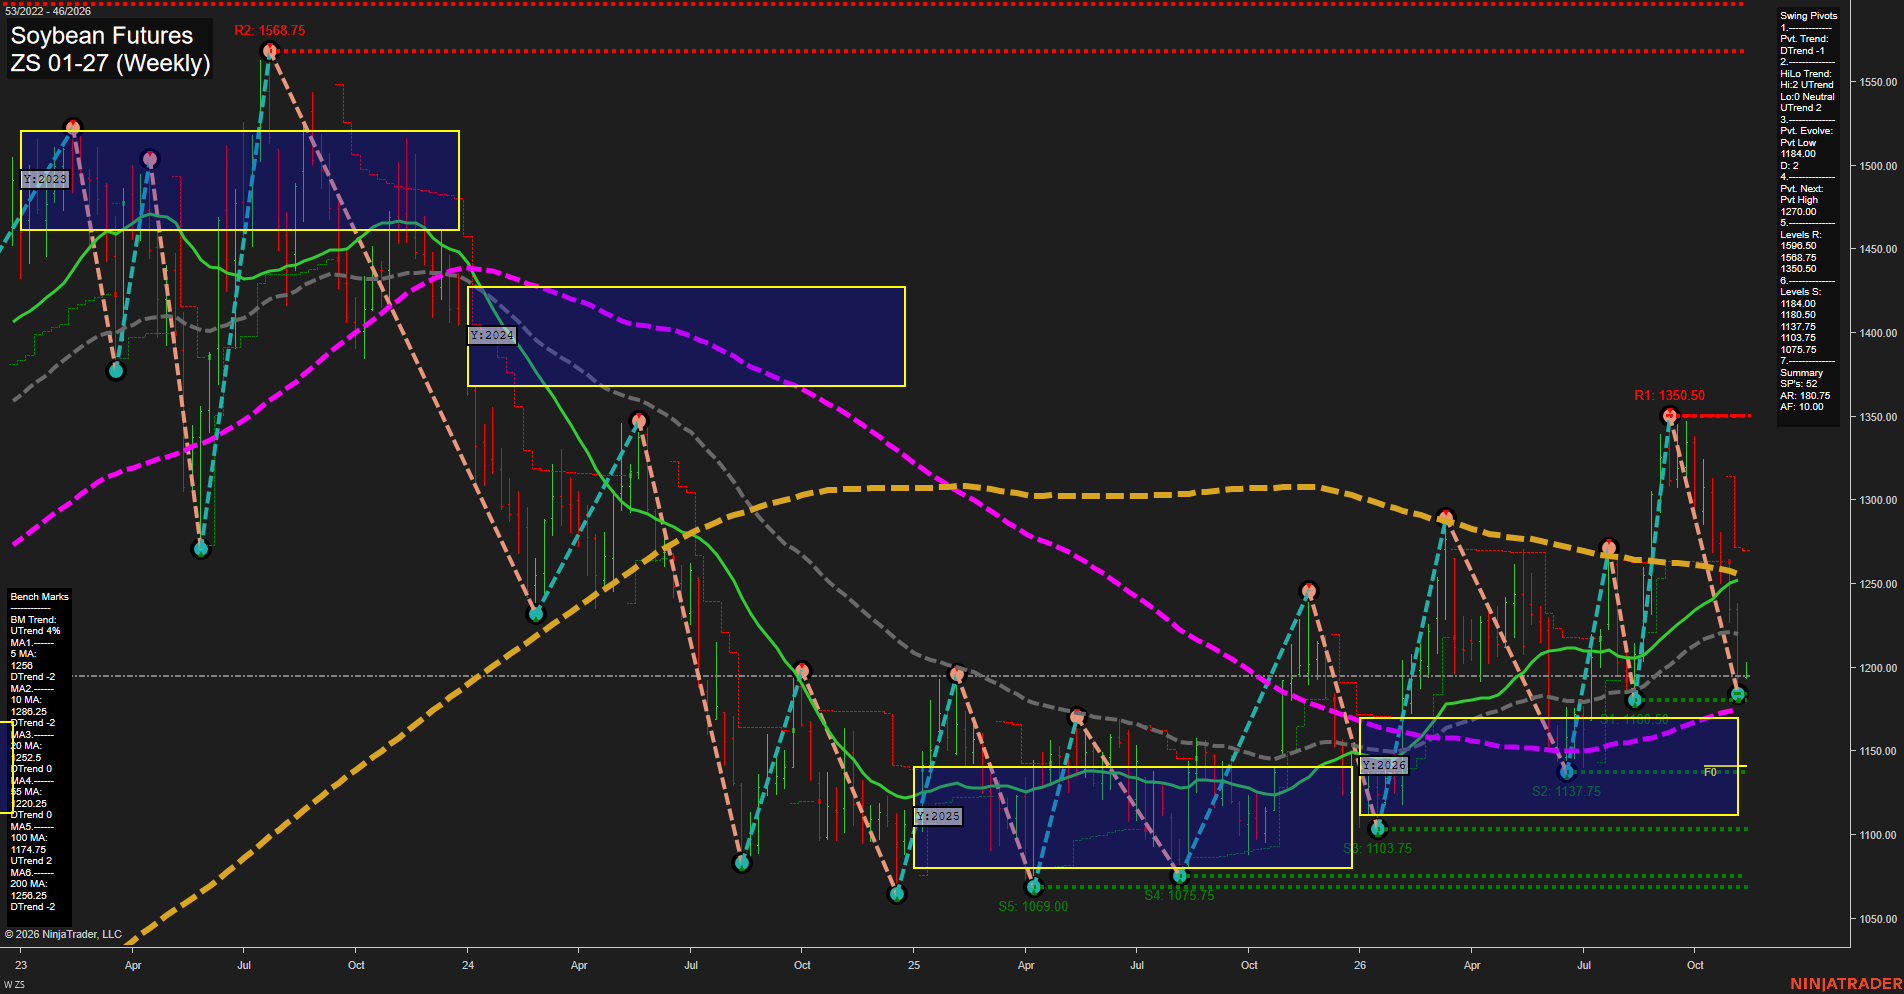
ZS Soybean Futures Weekly Chart Analysis: 2026-Nov-09 07:51 CT
Price Action
- Last: 1198.50,
- Bars: Medium,
- Mom: Average.
WSFG Weekly
- Short-Term
- WSFG Current: 1%
- F0%/NTZ' Bias: Price Above,
- WSFG Trend: Up.
MSFG Month Nov
- Intermediate-Term
- MSFG Current: -44%
- F0%/NTZ' Bias: Price Below,
- MSFG Trend: Down.
YSFG Year 2026
- Long-Term
- YSFG Current: 18%
- F0%/NTZ' Bias: Price Above,
- YSFG Trend: Up.
Swing Pivots
- (Short-Term) 1. Pvt. Trend: DTrend,
- (Intermediate-Term) 2. HiLo Trend: UTrend,
- 3. Pvt. Evolve: Pvt low 1184.00,
- 4. Pvt. Next: Pvt high 1270.00,
- 5. Levels R: 1598.50, 1568.75, 1350.50,
- 6. Levels S: 1137.75, 1134.00, 1130.50, 1103.75, 1075.75.
Weekly Benchmarks
- (Short-Term) 5 Day: 1258.00 Down Trend,
- (Short-Term) 10 Day: 1288.25 Down Trend,
- (Intermediate-Term) 20 Day: 1254.50 Down Trend,
- (Intermediate-Term) 55 Day: 1220.25 Up Trend,
- (Long-Term) 100 Day: 1174.75 Up Trend,
- (Long-Term) 200 Day: 1258.25 Down Trend.
Recent Trade Signals
- 09 Nov 2026: Long ZS 01-27 @ 1198.75 Signals.USAR-WSFG
- 03 Nov 2026: Short ZS 01-27 @ 1219 Signals.USAR-MSFG
Overall Rating
- Short-Term: Bearish,
- Intermediate-Term: Bearish,
- Long-Term: Bullish.
Key Insights Summary
Price is holding marginally above the weekly F0% area and has produced a short-term WSFG recovery signal, but the active pivot structure remains in DTrend following the decline from the 1350.50 swing high into the 1184.00 pivot low. The rebound is occurring beneath the 5-, 10-, 20-, and 55-week benchmarks, defining overhead technical pressure through 1220.25 to 1288.25. The monthly grid remains negative and supports the intermediate downtrend/countertrend-bounce theme, while the yearly grid and rising 100-week benchmark preserve a broader constructive long-term backdrop. The 1137.75 to 1130.50 support cluster defines the nearest lower range boundary, with 1270.00 identified as the next upside pivot-reversal level.
Chart Analysis ATS AI Generated: 2026-11-09 07:51 for Informational use only, not trading advice. Terms and Risk Disclosure Copyright © 2026. Algo Trading Systems LLC.