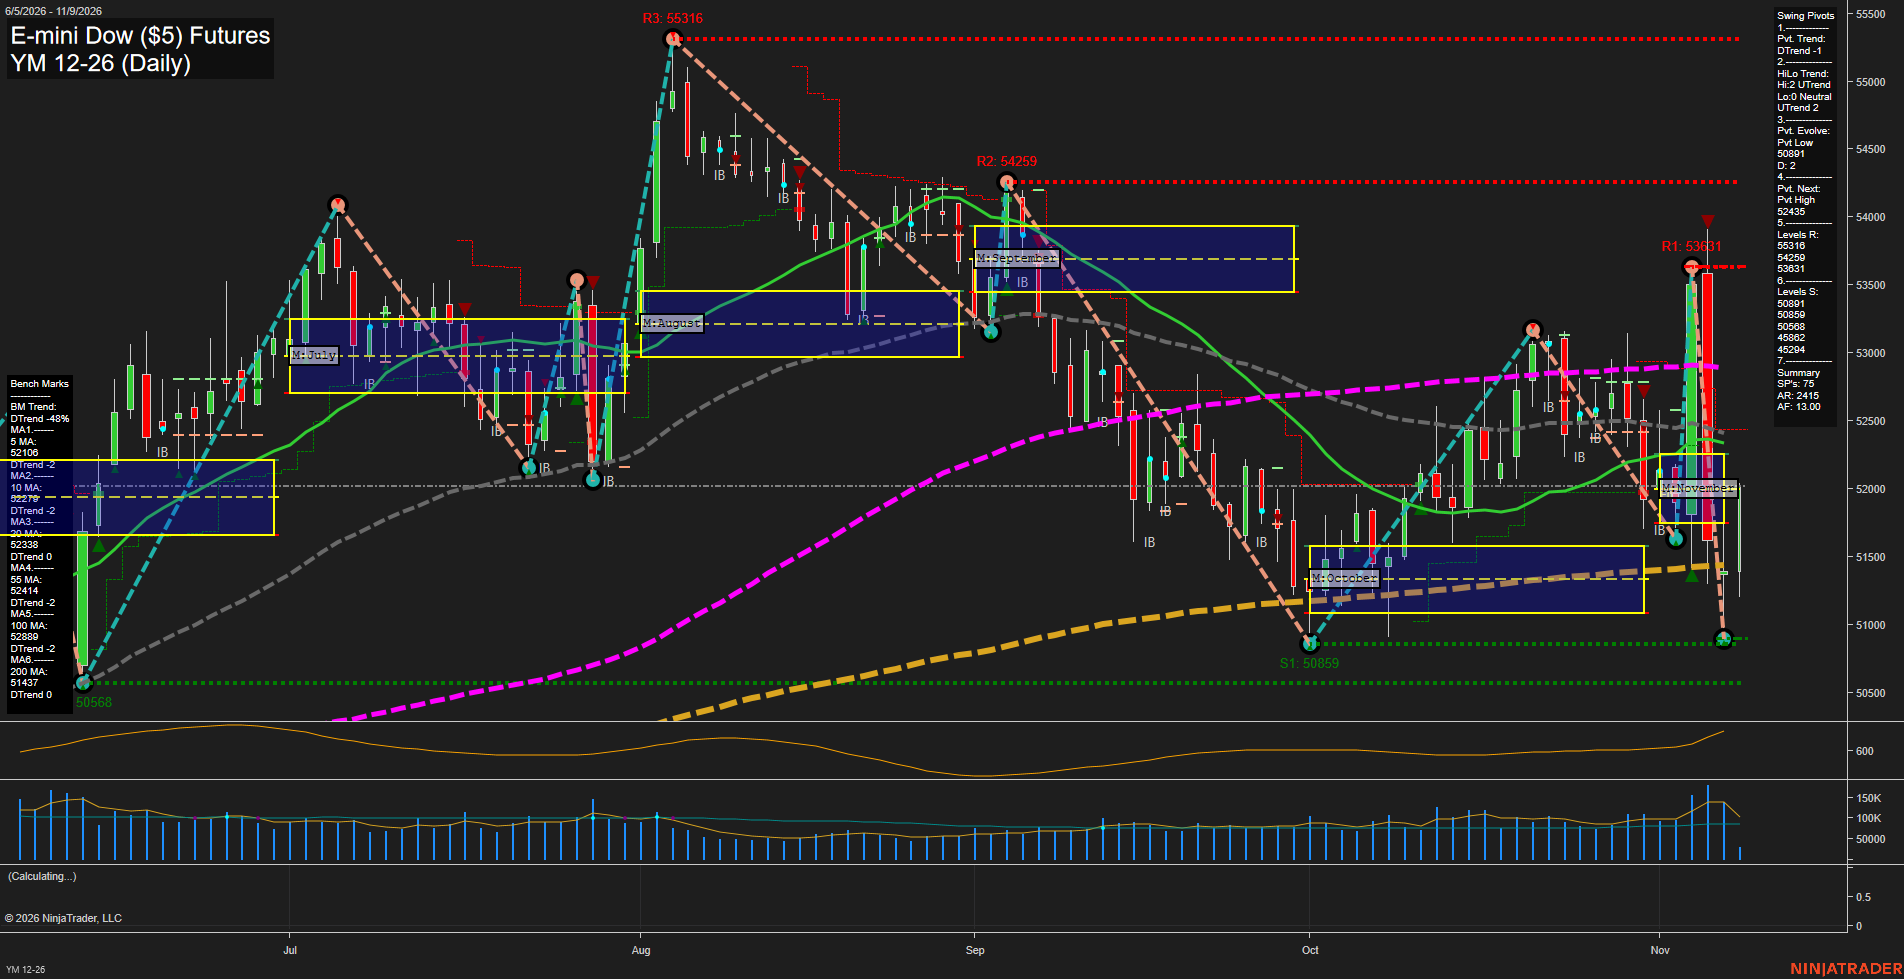
YM E-mini Dow ($5) Futures Daily Chart Analysis: 2026-Nov-09 07:49 CT
Price Action
- Last: 51668,
- Bars: Large,
- Mom: fast.
WSFG Weekly
- Short-Term
- WSFG Current: 37%
- F0%/NTZ' Bias: Price Above,
- WSFG Trend: Up.
MSFG Month Nov
- Intermediate-Term
- MSFG Current: 1%
- F0%/NTZ' Bias: Price Above,
- MSFG Trend: Up.
YSFG Year 2026
- Long-Term
- YSFG Current: 27%
- F0%/NTZ' Bias: Price Above,
- YSFG Trend: Up.
Swing Pivots
- (Short-Term) 1. Pvt. Trend: DTrend,
- (Intermediate-Term) 2. HiLo Trend: UTrend,
- 3. Pvt. Evolve: Pvt low 50891,
- 4. Pvt. Next: Pvt high 52435,
- 5. Levels R: 55316, 54259, 53631,
- 6. Levels S: 50891, 50859, 50568, 45862, 45294.
Daily Benchmarks
- (Short-Term) 5 Day: 52106 Down Trend,
- (Short-Term) 10 Day: 52279 Down Trend,
- (Intermediate-Term) 20 Day: 52339 Down Trend,
- (Intermediate-Term) 55 Day: 52414 Down Trend,
- (Long-Term) 100 Day: 52889 Down Trend,
- (Long-Term) 200 Day: 51437 Down Trend.
Additional Metrics
Recent Trade Signals
- 09 Nov 2026: Long YM 12-26 @ 51732 Signals.USAR-WSFG
- 09 Nov 2026: Short YM 12-26 @ 51688 Signals.USAR-MSFG
Overall Rating
- Short-Term: Bearish,
- Intermediate-Term: Bearish,
- Long-Term: Bearish.
Key Insights Summary
The daily chart shows a high-volatility downside reversal following rejection near the 53631 pivot resistance area. Price closed at 51668 beneath the 5-, 10-, 20-, 55-, and 100-day benchmarks, while the short-term pivot trend remains down. The intermediate HiLo structure remains upward, creating a counter-trend condition between the broader Fib-grid bias and the daily moving-average alignment. The sharp November decline has returned price toward the 50891 to 50568 support band, with elevated ATR and volume indicating fast momentum and expanded daily range behavior. A recovery above the 52435 next-pivot threshold would mark a meaningful change in the short-term pivot sequence, while the current structure remains defined by lower highs from the 54259 and 53631 resistance zones.
Chart Analysis ATS AI Generated: 2026-11-09 07:49 for Informational use only, not trading advice. Terms and Risk Disclosure Copyright © 2026. Algo Trading Systems LLC.