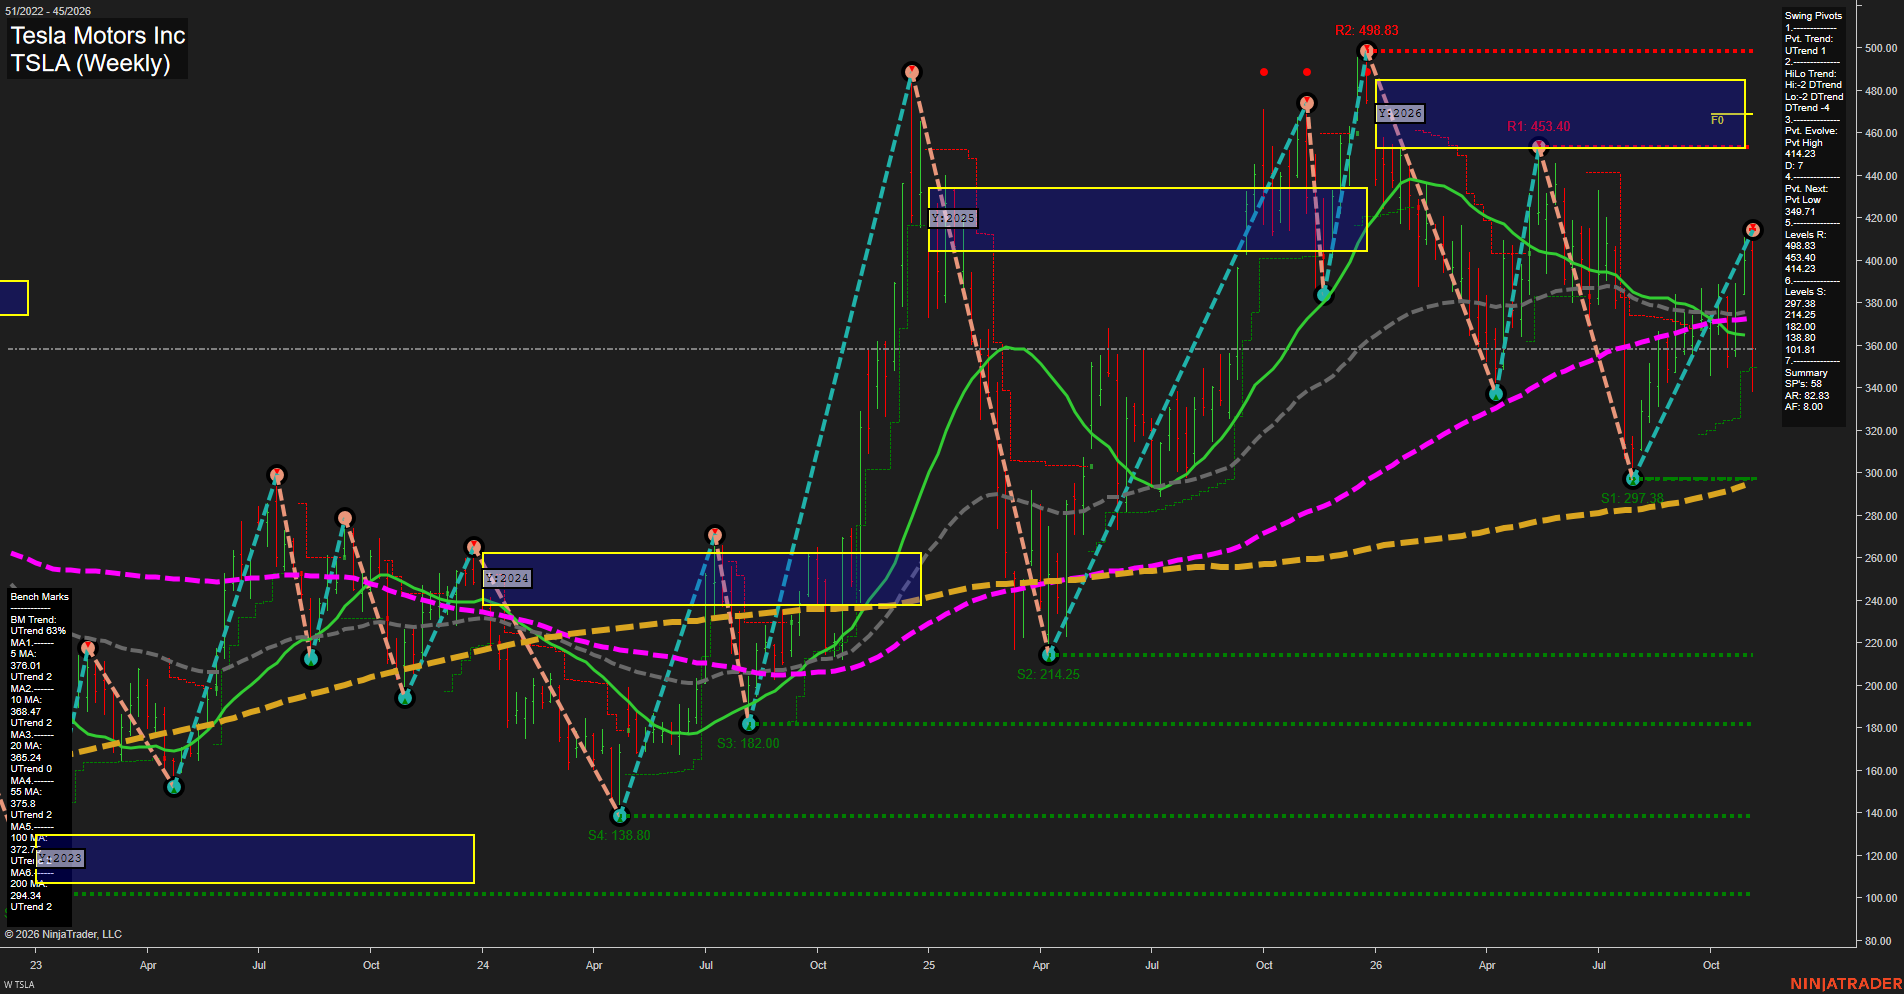
TSLA Tesla Motors Inc Weekly Chart Analysis: 2026-Nov-09 07:48 CT
Price Action
- Last: 370.00,
- Bars: Medium,
- Mom: Average.
WSFG Weekly
- Short-Term
- WSFG Current: NA%
- F0%/NTZ' Bias: Price Neutral,
- WSFG Trend: Neutral.
MSFG Month Nov
- Intermediate-Term
- MSFG Current: NA%
- F0%/NTZ' Bias: Price Neutral,
- MSFG Trend: Neutral.
YSFG Year 2026
- Long-Term
- YSFG Current: NA%
- F0%/NTZ' Bias: Price Below NTZ,
- YSFG Trend: Bearish.
Swing Pivots
- (Short-Term) 1. Pvt. Trend: UTrend,
- (Intermediate-Term) 2. HiLo Trend: DTrend,
- 3. Pvt. Evolve: Pvt high 414.23,
- 4. Pvt. Next: Pvt low 369.71,
- 5. Levels R: 498.83, 453.40, 414.23,
- 6. Levels S: 297.38, 214.25, 182.00, 138.80.
Weekly Benchmarks
- (Short-Term) 5 Day: 376.63 Up Trend,
- (Short-Term) 10 Day: 368.47 Up Trend,
- (Intermediate-Term) 20 Day: 365.27 Up Trend,
- (Intermediate-Term) 55 Day: 375.80 Up Trend,
- (Long-Term) 100 Day: 372.71 Up Trend,
- (Long-Term) 200 Day: 294.24 Up Trend.
Overall Rating
- Short-Term: Bullish,
- Intermediate-Term: Neutral,
- Long-Term: Bullish.
Key Insights Summary
TSLA futures structure reflects a short-term recovery from the 297.38 swing low, with price holding above the rising 10, 20, and 200-period benchmarks. The current 370 area is a crowded pivot and moving-average zone, sitting beneath 372.71, 375.80, and 376.63 while remaining above the 365.27 and 368.47 supports. The active pivot trend is up, but the intermediate HiLo structure remains down because the 414.23 pivot high is below the larger 453.40 and 498.83 resistance sequence. Price remains below the 2026 yearly NTZ near the 455 to 488 region, defining the larger retracement context. The chart is characterized by wide weekly swings, sharp V-style reversals, and elevated volatility rather than a smooth directional auction.
Chart Analysis ATS AI Generated: 2026-11-09 07:48 for Informational use only, not trading advice. Terms and Risk Disclosure Copyright © 2026. Algo Trading Systems LLC.