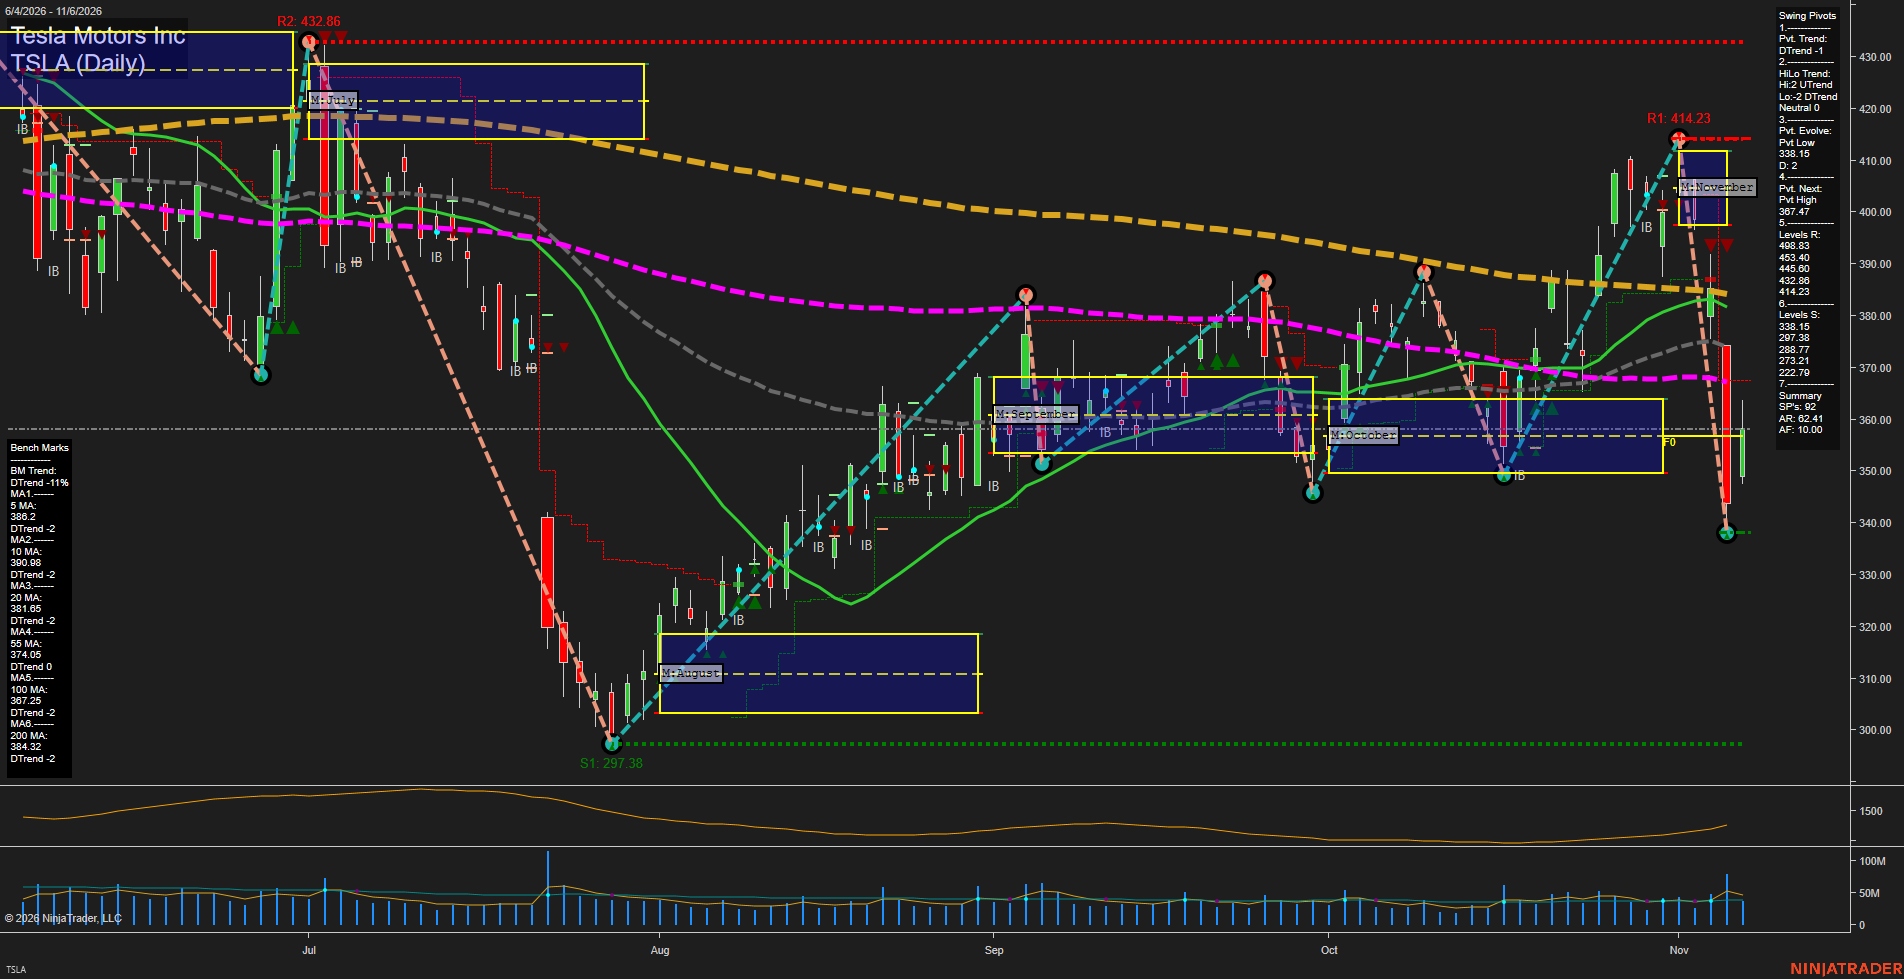
TSLA Tesla Motors Inc Daily Chart Analysis: 2026-Nov-09 07:48 CT
Price Action
- Last: 359.29,
- Bars: Large,
- Mom: fast.
WSFG Weekly
- Short-Term
- WSFG Current: NA%
- F0%/NTZ' Bias: Price Neutral,
- WSFG Trend: Neutral.
MSFG Month Nov
- Intermediate-Term
- MSFG Current: 4%
- F0%/NTZ' Bias: Price Neutral,
- MSFG Trend: Neutral.
YSFG Year 2026
- Long-Term
- YSFG Current: NA%
- F0%/NTZ' Bias: Price Neutral,
- YSFG Trend: Neutral.
Swing Pivots
- (Short-Term) 1. Pvt. Trend: DTrend,
- (Intermediate-Term) 2. HiLo Trend: UTrend,
- 3. Pvt. Evolve: Pvt low 338.25,
- 4. Pvt. Next: Pvt high 367.47,
- 5. Levels R: 498.33, 453.40, 445.60, 438.26, 414.23,
- 6. Levels S: 338.15, 297.38, 288.77, 273.21, 222.79.
Daily Benchmarks
- (Short-Term) 5 Day: 386.20 Down Trend,
- (Short-Term) 10 Day: 390.98 Down Trend,
- (Intermediate-Term) 20 Day: 381.69 Down Trend,
- (Intermediate-Term) 55 Day: 374.05 Down Trend,
- (Long-Term) 100 Day: 367.25 Down Trend,
- (Long-Term) 200 Day: 384.32 Down Trend.
Additional Metrics
- ATR: 62.41,
- VOLMA: 42000000.
Overall Rating
- Short-Term: Bearish,
- Intermediate-Term: Neutral,
- Long-Term: Bearish.
Key Insights Summary
Price action shows a high-volatility reversal from the 414.23 pivot resistance area into a sharp decline that undercut all major daily benchmark averages. The short-term pivot structure is bearish, with 367.47 defining the next upside reversal threshold and 338.15 defining nearby pivot support. Intermediate pivot structure remains upward because the broader sequence retains higher swing-low context from the August base, although price is currently in a strong countertrend retracement. The November MSFG is centered near the 357 area, placing the 359.29 close near the monthly F0% balance region after the rapid selloff and rebound. Futures-style swing conditions are choppy and expanded, with large bars, fast downside momentum, elevated ATR, and overhead benchmark congestion between 367.25 and 390.98.
Chart Analysis ATS AI Generated: 2026-11-09 07:48 for Informational use only, not trading advice. Terms and Risk Disclosure Copyright © 2026. Algo Trading Systems LLC.