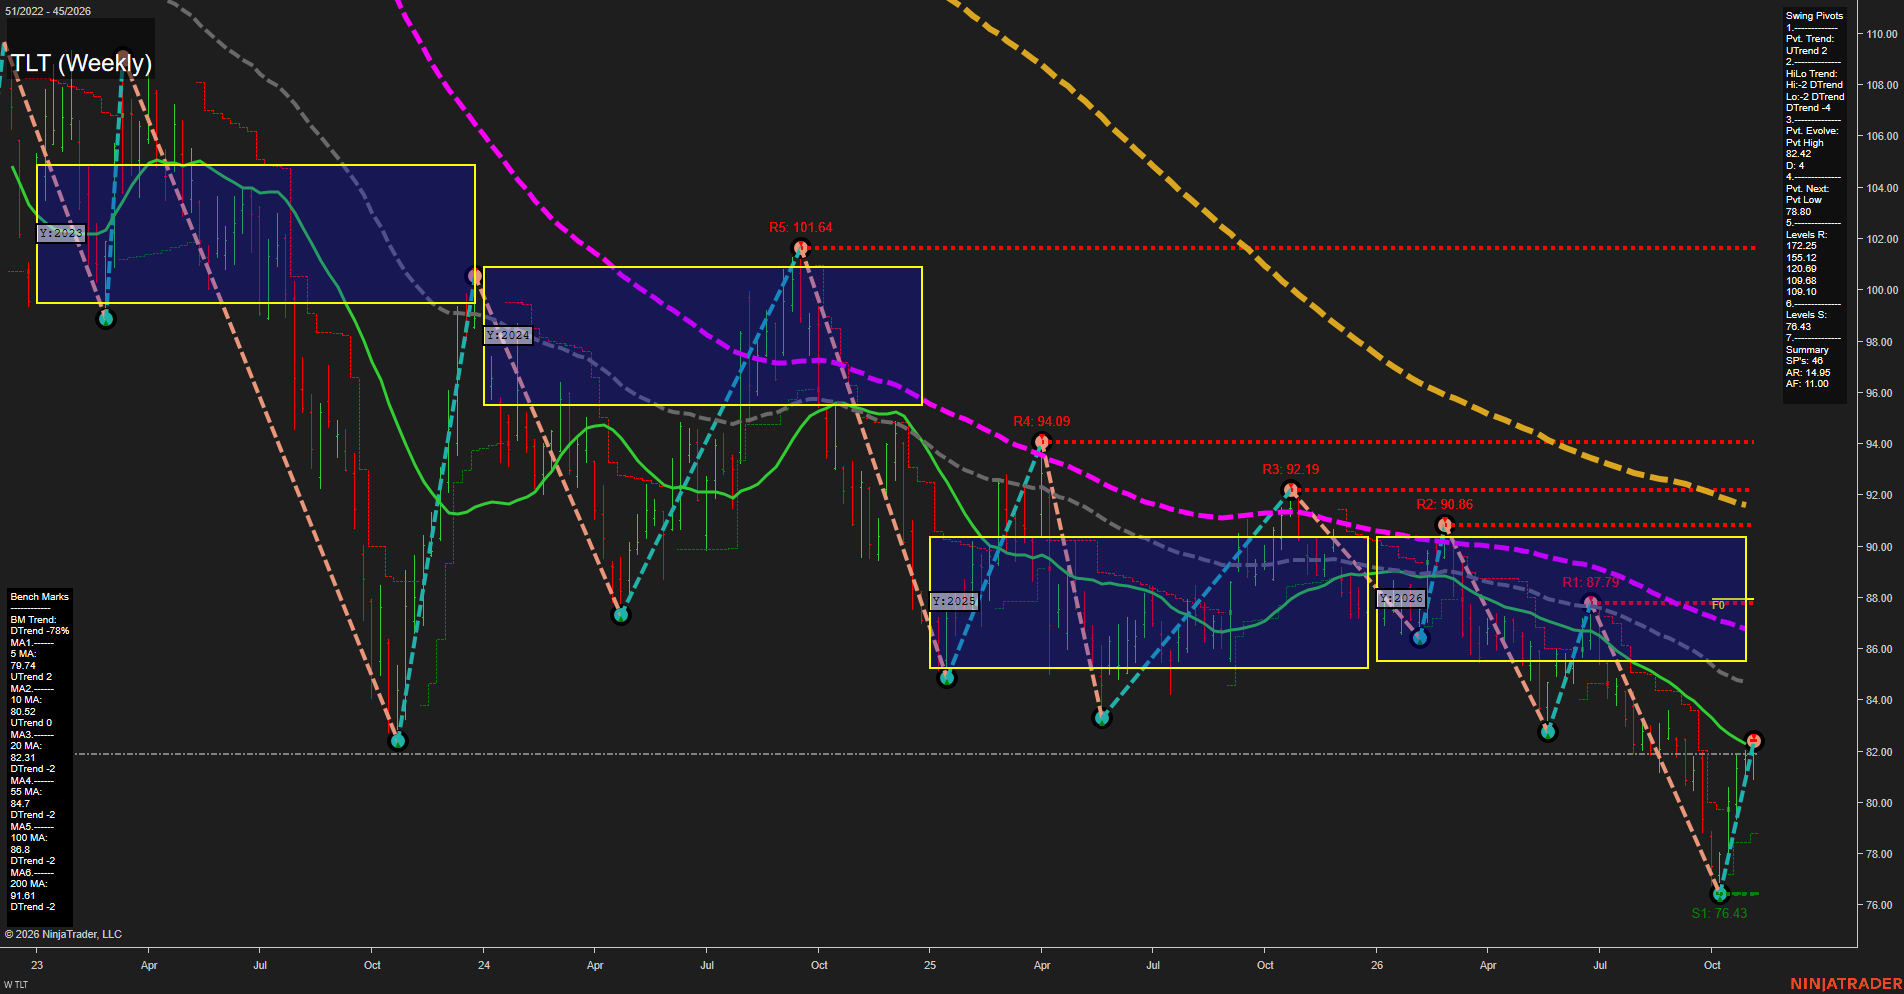
TLT TLT Weekly Chart Analysis: 2026-Nov-09 07:29 CT
Price Action
- Last: 82.15,
- Bars: Medium,
- Mom: Fast.
WSFG Weekly
- Short-Term
- WSFG Current: NA%
- F0%/NTZ' Bias: Price Bearish,
- WSFG Trend: Bearish.
MSFG Month Nov
- Intermediate-Term
- MSFG Current: NA%
- F0%/NTZ' Bias: Price Bearish,
- MSFG Trend: Bearish.
YSFG Year 2026
- Long-Term
- YSFG Current: NA%
- F0%/NTZ' Bias: Price Bearish,
- YSFG Trend: Bearish.
Swing Pivots
- (Short-Term) 1. Pvt. Trend: UTrend,
- (Intermediate-Term) 2. HiLo Trend: DTrend,
- 3. Pvt. Evolve: Pvt high 82.42,
- 4. Pvt. Next: Pvt low 58.80,
- 5. Levels R: 153.12, 122.25, 120.69, 109.68, 109.10,
- 6. Levels S: 76.43.
Weekly Benchmarks
- (Short-Term) 5 Day: 79.74 Up Trend,
- (Short-Term) 10 Day: 80.52 Up Trend,
- (Intermediate-Term) 20 Day: 82.31 Down Trend,
- (Intermediate-Term) 55 Day: 84.70 Down Trend,
- (Long-Term) 100 Day: 86.80 Down Trend,
- (Long-Term) 200 Day: 91.60 Down Trend.
Overall Rating
- Short-Term: Bullish,
- Intermediate-Term: Bearish,
- Long-Term: Bearish.
Key Insights Summary
TLT’s weekly structure reflects a fast counter-trend rebound from the 76.43 swing low, with price recovering above the rising 5- and 10-week benchmarks. From a futures swing-trader perspective, the short-term Treasury-bond rebound is constructive but remains counter to the broader declining structure: price is marginally below the 20-week benchmark at 82.31 and materially below the 55-, 100-, and 200-week benchmarks. The short-term pivot trend has turned upward, while the intermediate HiLo trend remains downward, defining the current move as a rebound inside a longer-term bearish rate-product cycle. The 82.42 evolving pivot-high area is the immediate structural test; a sustained recovery through the nearby moving-average cluster would improve the rebound’s character, while rejection would preserve the sequence of lower highs. The 76.43 pivot low remains the dominant weekly support reference.
Chart Analysis ATS AI Generated: 2026-11-09 07:29 for Informational use only, not trading advice. Terms and Risk Disclosure Copyright © 2026. Algo Trading Systems LLC.