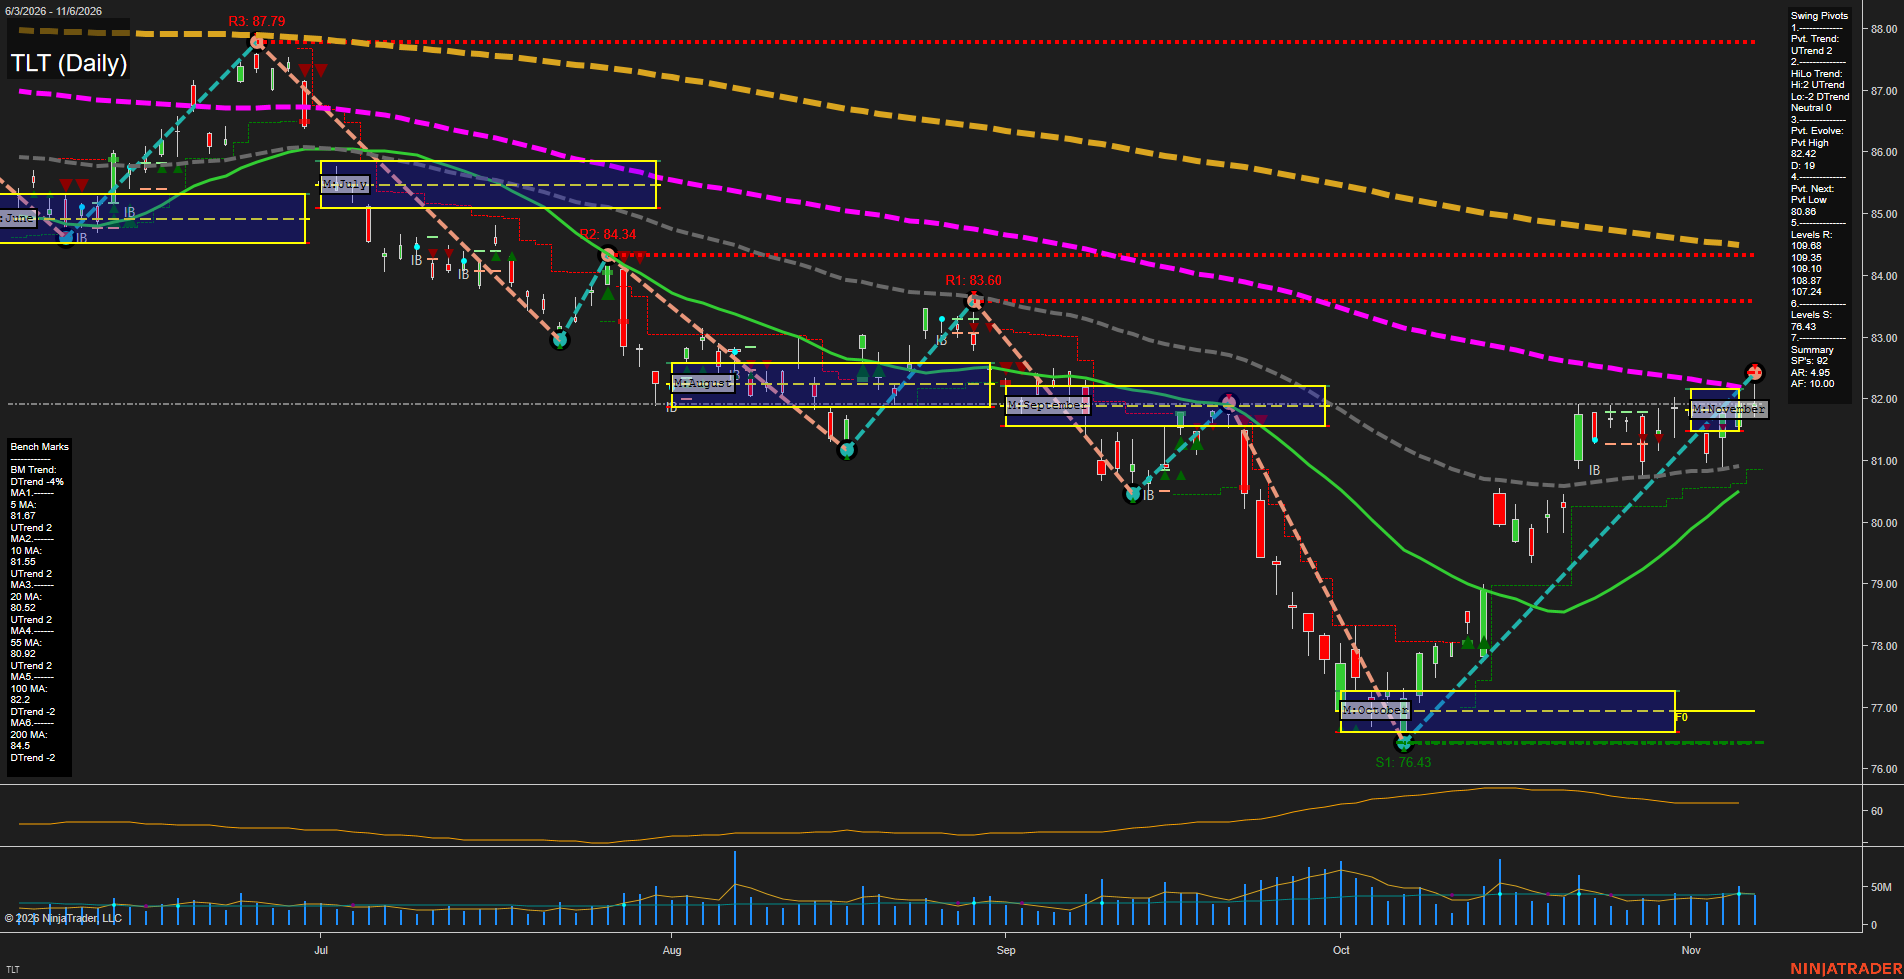
TLT TLT Daily Chart Analysis: 2026-Nov-09 07:29 CT
Price Action
- Last: 82.42,
- Bars: Medium,
- Mom: Fast.
WSFG Weekly
- Short-Term
- WSFG Current: NA%
- F0%/NTZ' Bias: Price Neutral,
- WSFG Trend: Neutral.
MSFG Month Nov
- Intermediate-Term
- MSFG Current: NA%
- F0%/NTZ' Bias: Price Neutral,
- MSFG Trend: Neutral.
YSFG Year 2026
- Long-Term
- YSFG Current: NA%
- F0%/NTZ' Bias: Price Neutral,
- YSFG Trend: Neutral.
Swing Pivots
- (Short-Term) 1. Pvt. Trend: UTrend,
- (Intermediate-Term) 2. HiLo Trend: UTrend,
- 3. Pvt. Evolve: Pvt high 82.42,
- 4. Pvt. Next: Pvt low 80.86,
- 5. Levels R: 109.68, 109.35, 109.10, 108.38, 107.24,
- 6. Levels S: 77.00, 76.43.
Daily Benchmarks
- (Short-Term) 5 Day: 81.67 Up Trend,
- (Short-Term) 10 Day: 81.55 Up Trend,
- (Intermediate-Term) 20 Day: 80.53 Up Trend,
- (Intermediate-Term) 55 Day: 80.92 Up Trend,
- (Long-Term) 100 Day: 82.20 Down Trend,
- (Long-Term) 200 Day: 84.50 Down Trend.
Additional Metrics
- ATR: 65,
- VOLMA: 38827181.
Overall Rating
- Short-Term: Bullish,
- Intermediate-Term: Bullish,
- Long-Term: Bearish.
Key Insights Summary
TLT is in a sharp short-term recovery phase following the October washout near 76.43. Price has established higher lows and higher highs, reclaimed the 5-, 10-, 20-, and 55-day benchmarks, and the swing-pivot structure is classified as an UTrend. From a futures swing perspective, the 82.42 pivot high is the immediate upside inflection area, while 80.86 defines the opposite-pivot level underlying the current advance. The rally is counter-trend relative to the longer-term structure because price remains beneath declining 100- and 200-day benchmarks. This creates a bullish near-term momentum condition within a still-bearish long-term price cycle.
Chart Analysis ATS AI Generated: 2026-11-09 07:29 for Informational use only, not trading advice. Terms and Risk Disclosure Copyright © 2026. Algo Trading Systems LLC.