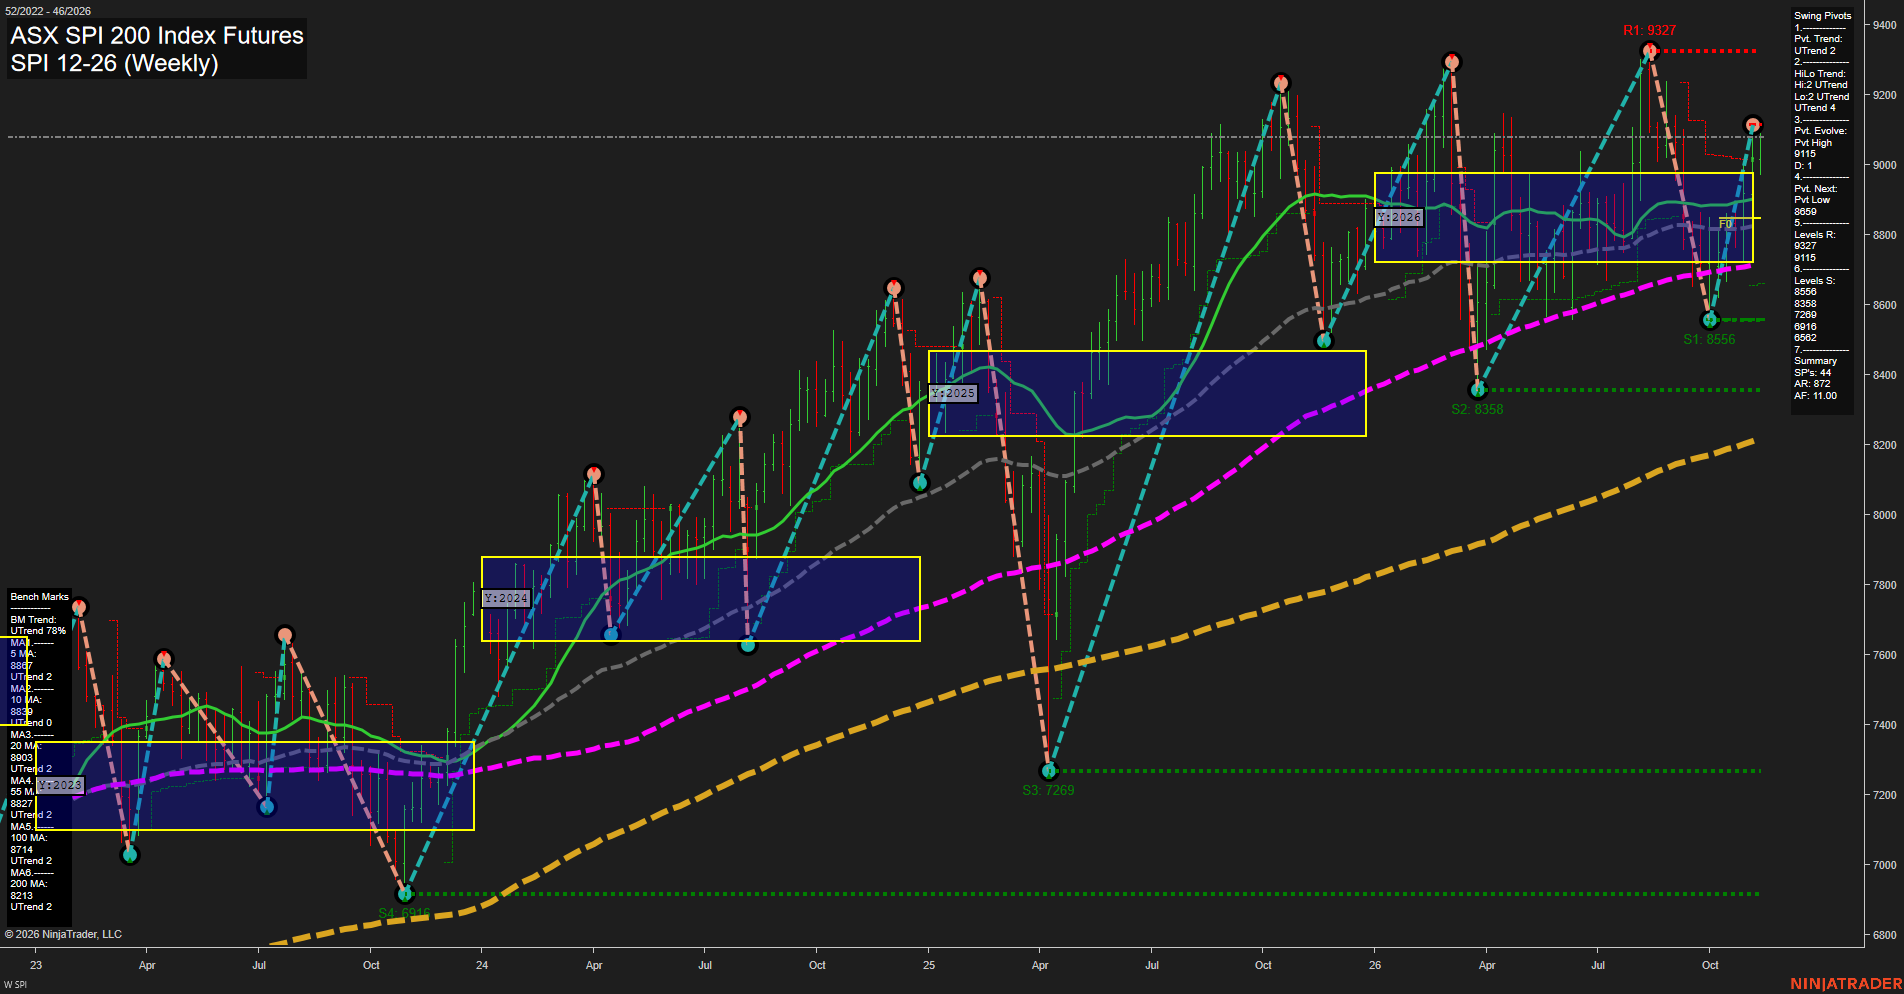
SPI ASX SPI 200 Index Futures Weekly Chart Analysis: 2026-Nov-09 07:47 CT
Price Action
- Last: 9058,
- Bars: Medium,
- Mom: fast.
WSFG Weekly
- Short-Term
- WSFG Current: NA%
- F0%/NTZ' Bias: Price Bullish,
- WSFG Trend: Bullish.
MSFG Month Nov
- Intermediate-Term
- MSFG Current: NA%
- F0%/NTZ' Bias: Price Bullish,
- MSFG Trend: Bullish.
YSFG Year 2026
- Long-Term
- YSFG Current: 127%
- F0%/NTZ' Bias: Price Bullish,
- YSFG Trend: Bullish.
Swing Pivots
- (Short-Term) 1. Pvt. Trend: UTrend,
- (Intermediate-Term) 2. HiLo Trend: UTrend,
- 3. Pvt. Evolve: Pvt high 9115,
- 4. Pvt. Next: Pvt low 8659,
- 5. Levels R: 9327, 9115,
- 6. Levels S: 8556, 8358, 7269, 6916.
Weekly Benchmarks
- (Short-Term) 5 Day: 9087 Up Trend,
- (Short-Term) 10 Day: 8839 Up Trend,
- (Intermediate-Term) 20 Day: 8903 Up Trend,
- (Intermediate-Term) 55 Day: 8827 Up Trend,
- (Long-Term) 100 Day: 8714 Up Trend,
- (Long-Term) 200 Day: 8213 Up Trend.
Overall Rating
- Short-Term: Bullish,
- Intermediate-Term: Bullish,
- Long-Term: Bullish.
Key Insights Summary
Price is staging a fast V-shaped recovery from the 8556 swing support and is now trading above the rising 10, 20, 55, 100, and 200-week benchmarks. Both pivot structures remain upward trending, although the current 9115 pivot high is the immediate overhead test; a sustained move through it would refocus the structure toward the 9327 major resistance. The yearly Fib grid has been reclaimed above its upper NTZ boundary, reinforcing the broader bullish cycle. The sharp rebound has increased near-term volatility, with 8903-8827 forming the closest benchmark support zone and 8659-8556 representing the more significant swing retracement area.
Chart Analysis ATS AI Generated: 2026-11-09 07:47 for Informational use only, not trading advice. Terms and Risk Disclosure Copyright © 2026. Algo Trading Systems LLC.