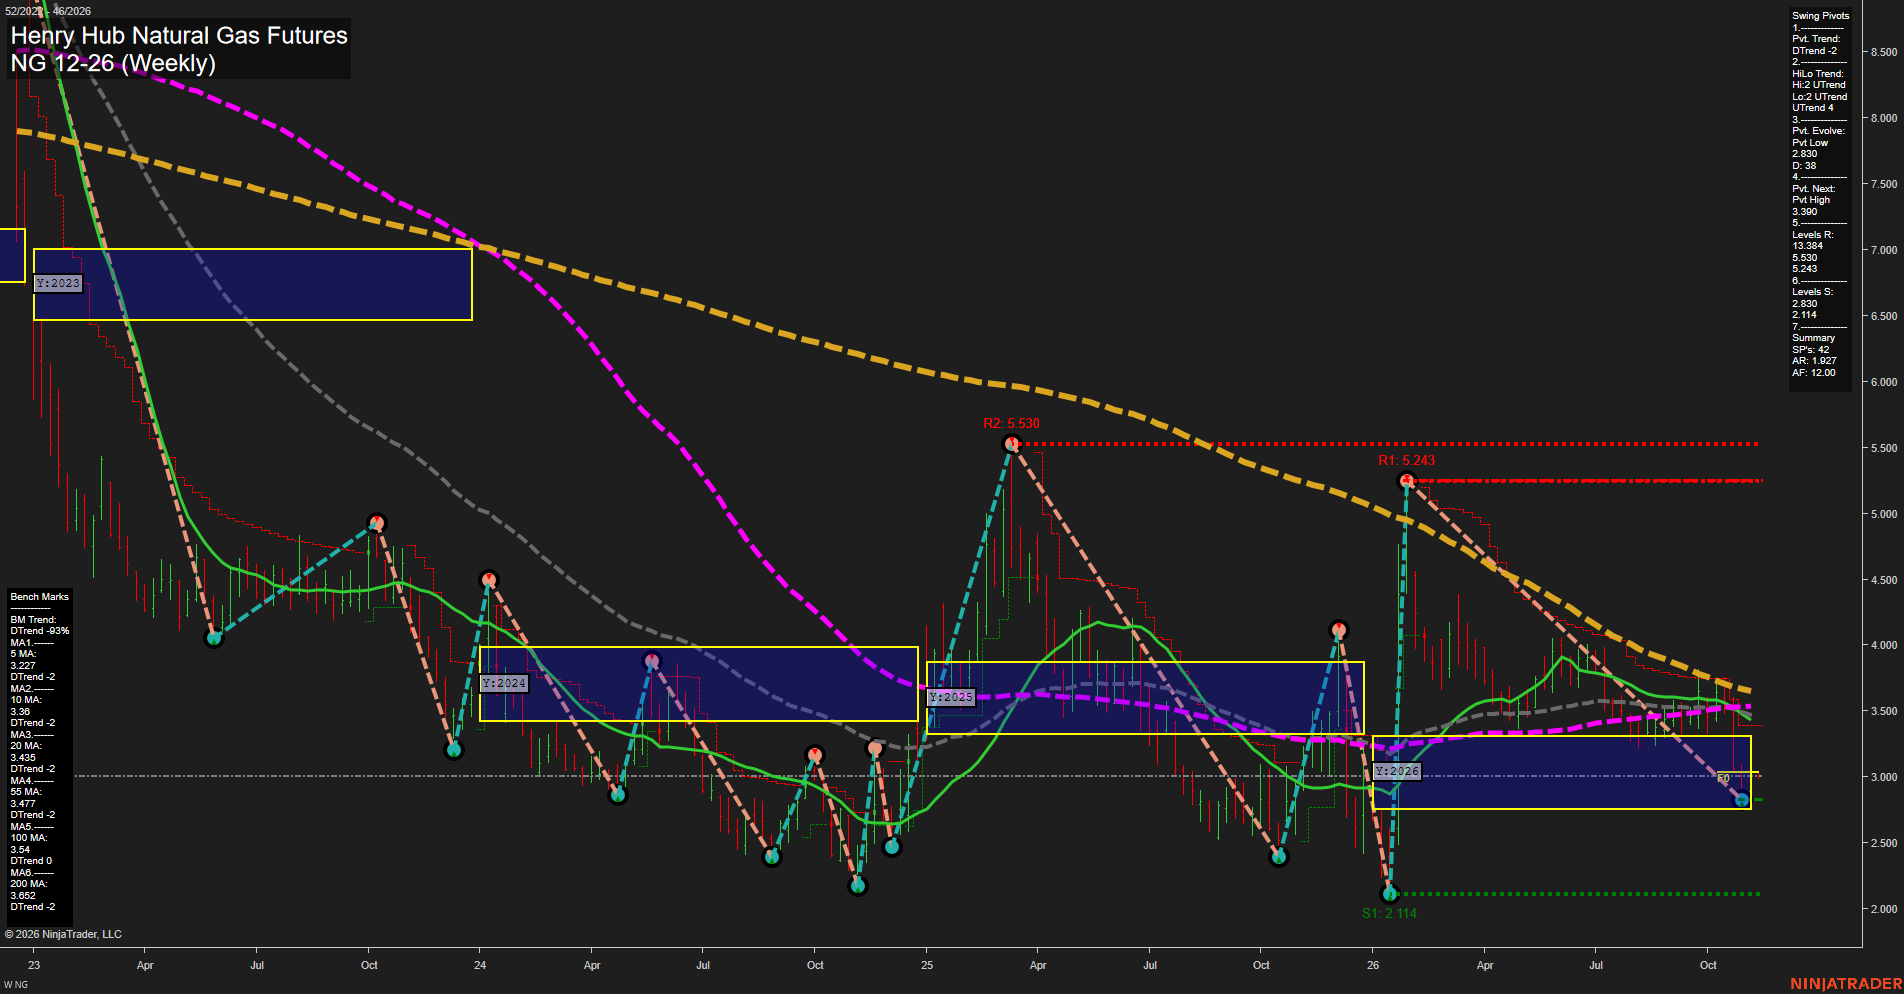
NG Henry Hub Natural Gas Futures Weekly Chart Analysis: 2026-Nov-09 07:43 CT
Price Action
- Last: 2.927,
- Bars: Small,
- Mom: Slow.
WSFG Weekly
- Short-Term
- WSFG Current: 31%
- F0%/NTZ' Bias: Price Above,
- WSFG Trend: Up.
MSFG Month Nov
- Intermediate-Term
- MSFG Current: 46%
- F0%/NTZ' Bias: Price Above,
- MSFG Trend: Up.
YSFG Year 2026
- Long-Term
- YSFG Current: 3%
- F0%/NTZ' Bias: Price Above,
- YSFG Trend: Up.
Swing Pivots
- (Short-Term) 1. Pvt. Trend: DTrend,
- (Intermediate-Term) 2. HiLo Trend: UTrend,
- 3. Pvt. Evolve: Pvt low 2.830,
- 4. Pvt. Next: Pvt high 3.390,
- 5. Levels R: 5.530, 5.243,
- 6. Levels S: 2.830, 2.114.
Weekly Benchmarks
- (Short-Term) 5 Day: 3.322 Down Trend,
- (Short-Term) 10 Day: 3.360 Down Trend,
- (Intermediate-Term) 20 Day: 3.435 Down Trend,
- (Intermediate-Term) 55 Day: 3.477 Down Trend,
- (Long-Term) 100 Day: 3.540 Down Trend,
- (Long-Term) 200 Day: 3.652 Down Trend.
Recent Trade Signals
- 06 Nov 2026: Long NG 12-26 @ 2.997 Signals.USAR-MSFG
- 05 Nov 2026: Long NG 12-26 @ 2.95 Signals.USAR-WSFG
Overall Rating
- Short-Term: Bearish,
- Intermediate-Term: Neutral,
- Long-Term: Neutral.
Key Insights Summary
NG is holding near the 2.830 pivot-low support after a prolonged decline from the early-2026 spike. The short-term pivot structure remains down and price is positioned beneath every weekly benchmark, showing broad moving-average compression and persistent downside trend pressure. The intermediate HiLo structure and positive Fib-grid trends preserve a broader basing/recovery theme, but the market has not yet regained the 3.390 pivot-reversal level or the clustered 3.322-3.652 benchmark band. The current pattern is a low-volatility consolidation near yearly-grid support, with 2.830 and 2.114 defining major downside structure and 5.243-5.530 remaining distant overhead pivot resistance.
Chart Analysis ATS AI Generated: 2026-11-09 07:44 for Informational use only, not trading advice. Terms and Risk Disclosure Copyright © 2026. Algo Trading Systems LLC.