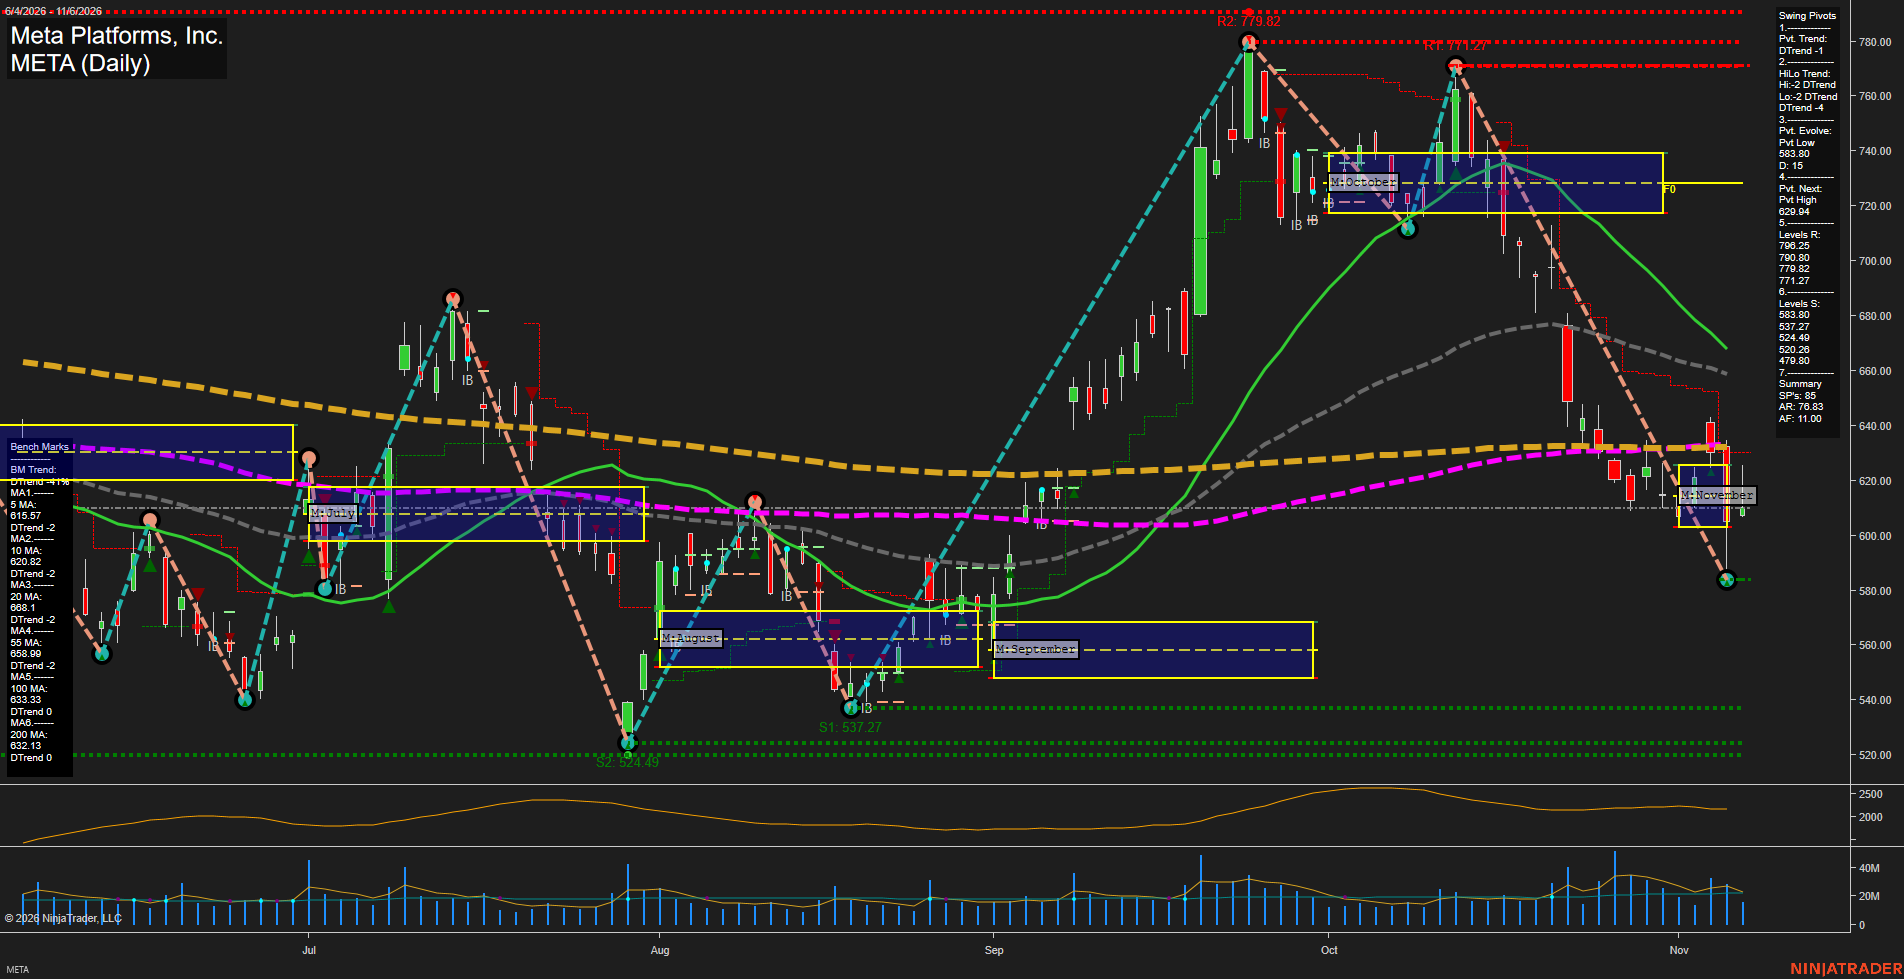
META Meta Platforms; Inc. Daily Chart Analysis: 2026-Nov-09 07:28 CT
Price Action
- Last: 632.13,
- Bars: Small,
- Mom: Slow.
WSFG Weekly
- Short-Term
- WSFG Current: NA%
- F0%/NTZ' Bias: Price Neutral,
- WSFG Trend: Neutral.
MSFG Month Nov
- Intermediate-Term
- MSFG Current: 87%
- F0%/NTZ' Bias: Price Above F0%,
- MSFG Trend: UTrend.
YSFG Year 2026
- Long-Term
- YSFG Current: NA%
- F0%/NTZ' Bias: Price Neutral,
- YSFG Trend: Neutral.
Swing Pivots
- (Short-Term) 1. Pvt. Trend: DTrend,
- (Intermediate-Term) 2. HiLo Trend: DTrend,
- 3. Pvt. Evolve: Pvt Low 583.80,
- 4. Pvt. Next: Pvt High 629.94,
- 5. Levels R: 796.25, 790.80, 779.82, 771.27,
- 6. Levels S: 583.80, 537.27, 524.49, 520.26, 479.80.
Daily Benchmarks
- (Short-Term) 5 Day: 615.57 Down Trend,
- (Short-Term) 10 Day: 620.82 Down Trend,
- (Intermediate-Term) 20 Day: 668.00 Down Trend,
- (Intermediate-Term) 55 Day: 658.99 Down Trend,
- (Long-Term) 100 Day: 633.33 Neutral Trend,
- (Long-Term) 200 Day: 632.13 Neutral Trend.
Additional Metrics
- ATR: 2162,
- VOLMA: 26211336.
Overall Rating
- Short-Term: Neutral,
- Intermediate-Term: Bearish,
- Long-Term: Neutral.
Key Insights Summary
META is attempting a sharp V-style rebound from the 583.80 pivot low after the October-to-November selloff, but the broader pivot structure remains in a DTrend with both short-term and intermediate-term swing measures bearish. Price has recovered above the November F0% area and is pressing the 629.94 next-pivot threshold, while the 100-day and 200-day benchmarks cluster near current price. The rebound remains counter-trend relative to the declining 20-day and 55-day averages overhead near 668.00 and 658.99. Small recent bars and slowing momentum indicate consolidation after the high-volatility decline rather than a fully established upside continuation. The principal structural support is 583.80, with 629.94 acting as the immediate pivot inflection level and 658.99-668.00 representing the nearby intermediate-term overhead benchmark zone.
Chart Analysis ATS AI Generated: 2026-11-09 07:28 for Informational use only, not trading advice. Terms and Risk Disclosure Copyright © 2026. Algo Trading Systems LLC.