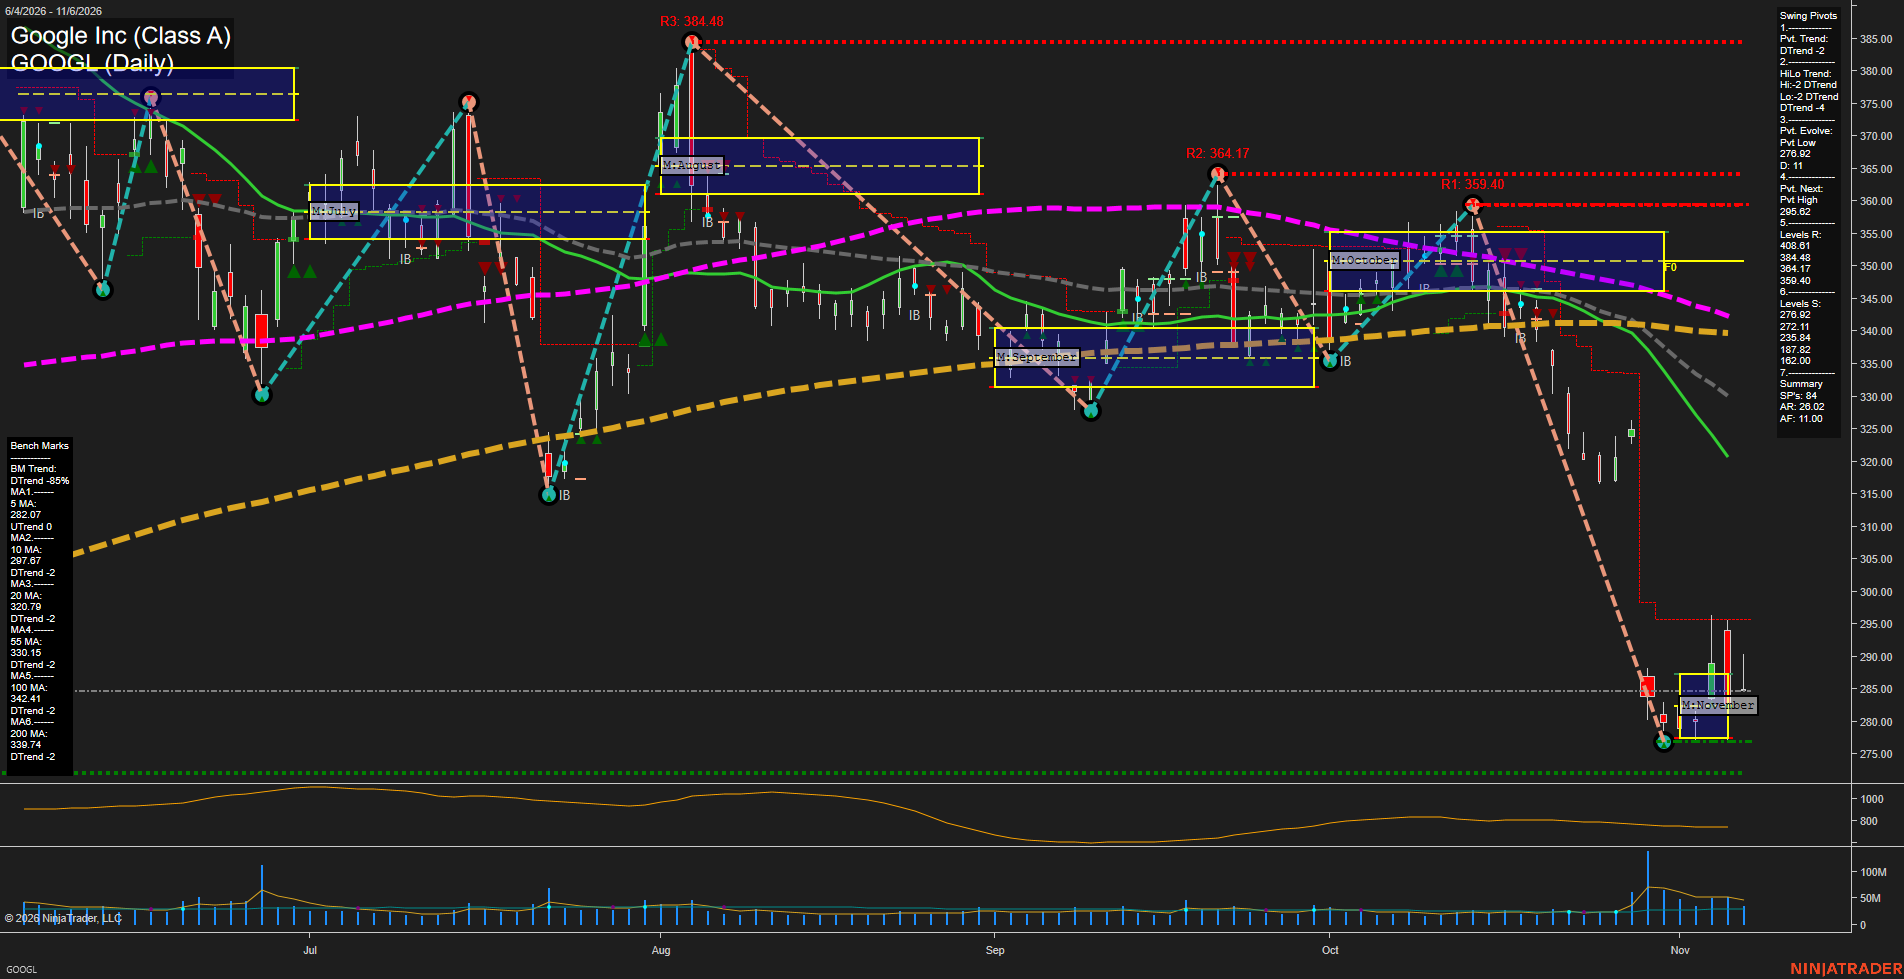
GOOGL Google Inc (Class A) Daily Chart Analysis: 2026-Nov-09 07:42 CT
Price Action
- Last: 284.40,
- Bars: Large,
- Mom: fast.
WSFG Weekly
- Short-Term
- WSFG Current: NA%
- F0%/NTZ' Bias: Price Neutral,
- WSFG Trend: Down.
MSFG Month Nov
- Intermediate-Term
- MSFG Current: NA%
- F0%/NTZ' Bias: Price Neutral,
- MSFG Trend: Down.
YSFG Year 2026
- Long-Term
- YSFG Current: NA%
- F0%/NTZ' Bias: Price Neutral,
- YSFG Trend: Down.
Swing Pivots
- (Short-Term) 1. Pvt. Trend: DTrend,
- (Intermediate-Term) 2. HiLo Trend: DTrend,
- 3. Pvt. Evolve: Pvt low 276.92,
- 4. Pvt. Next: Pvt high 295.62,
- 5. Levels R: 408.81, 384.48, 364.17, 359.40,
- 6. Levels S: 276.92, 272.11, 253.84, 187.82, 162.00, 72.00, 26.02.
Daily Benchmarks
- (Short-Term) 5 Day: 282.07 Up Trend,
- (Short-Term) 10 Day: 297.67 Down Trend,
- (Intermediate-Term) 20 Day: 327.79 Down Trend,
- (Intermediate-Term) 55 Day: 330.15 Down Trend,
- (Long-Term) 100 Day: 342.41 Down Trend,
- (Long-Term) 200 Day: 339.74 Down Trend.
Additional Metrics
- ATR: 420,
- VOLMA: 25379774.
Overall Rating
- Short-Term: Bearish,
- Intermediate-Term: Bearish,
- Long-Term: Bearish.
Key Insights Summary
Price is in a sharp downside swing following a breakdown from the October range and a sequence of lower highs and lower lows. The current rebound from the 276.92 pivot low remains counter-trend while price is below the declining 10-, 20-, 55-, 100-, and 200-day benchmarks. The 5-day average has turned upward, reflecting the immediate oversold bounce, but the pivot structure and benchmark alignment remain broadly bearish. Futures-style swing structure identifies 295.62 as the nearest pivot reversal threshold, while 276.92 and 272.11 define the nearby downside reference zone. Elevated range expansion and volume indicate a high-volatility liquidation/repricing phase rather than a mature base.
Chart Analysis ATS AI Generated: 2026-11-09 07:43 for Informational use only, not trading advice. Terms and Risk Disclosure Copyright © 2026. Algo Trading Systems LLC.