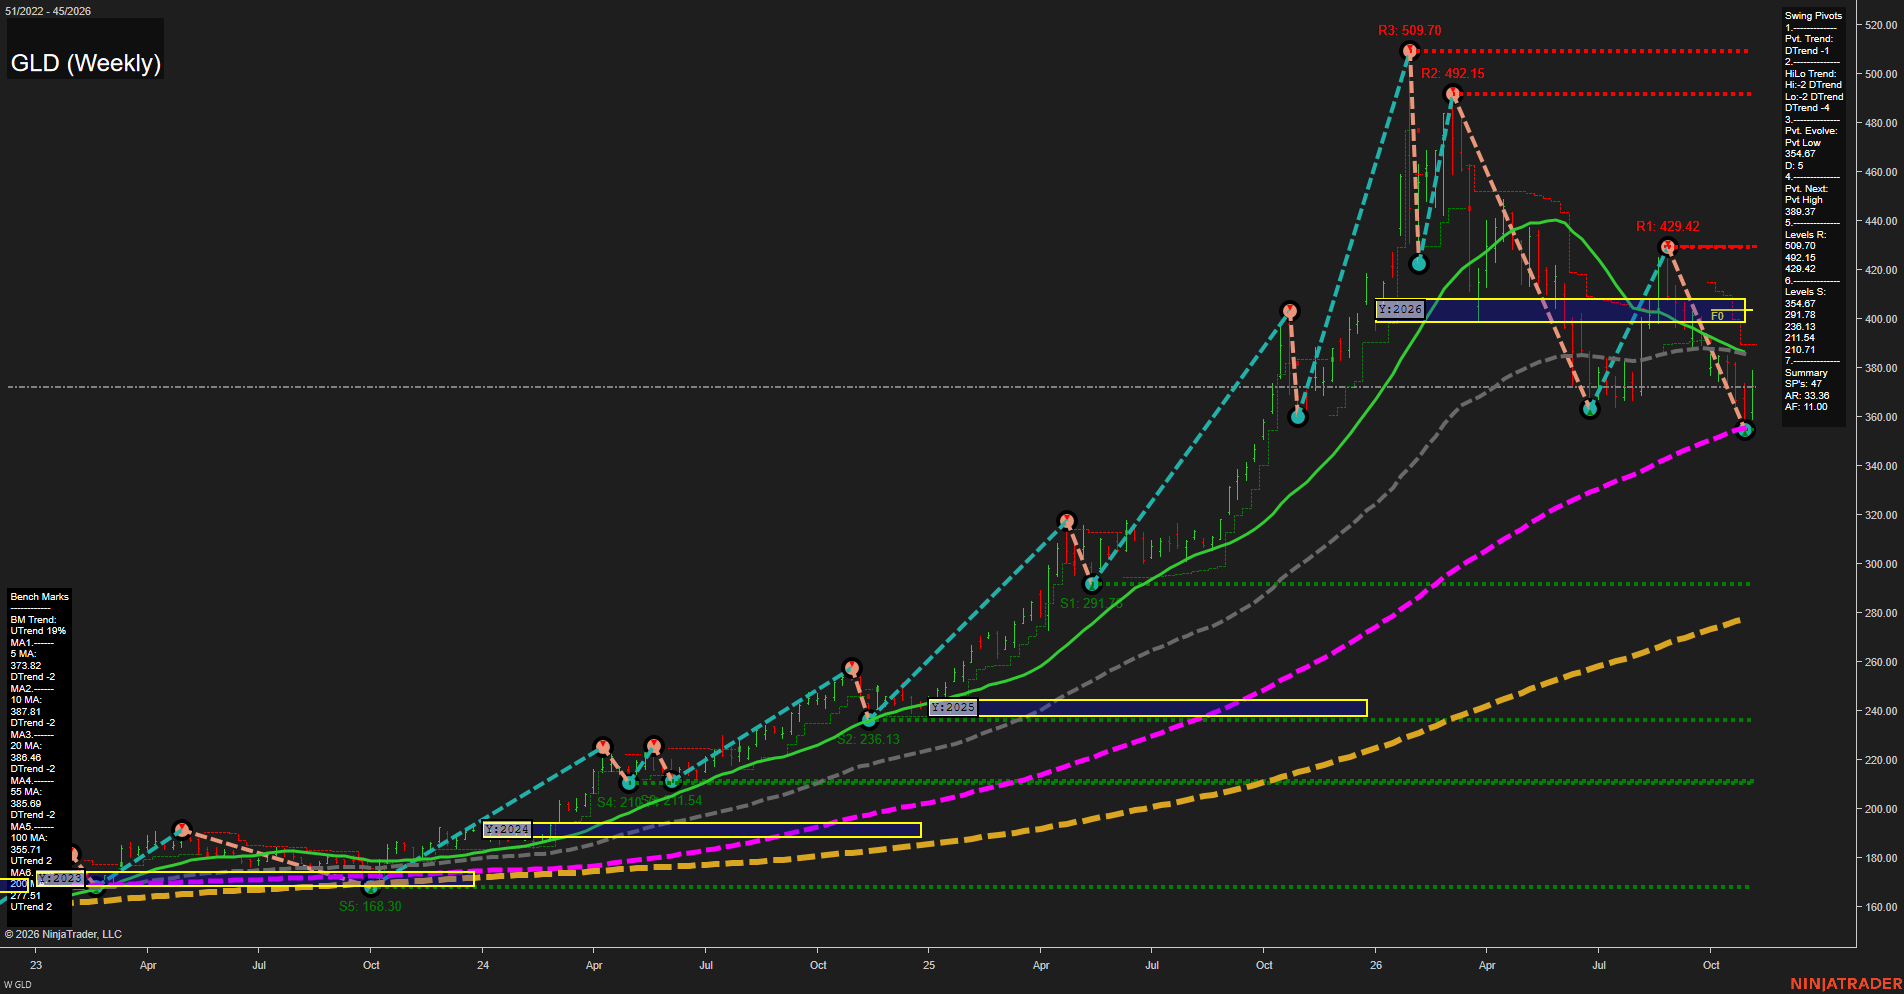
GLD SPDR Gold Shares Weekly Chart Analysis: 2026-Nov-09 07:42 CT
Price Action
- Last: 354.67,
- Bars: Large,
- Mom: fast.
WSFG Weekly
- Short-Term
- WSFG Current: NA%
- F0%/NTZ' Bias: Price Neutral,
- WSFG Trend: Neutral.
MSFG Month Nov
- Intermediate-Term
- MSFG Current: NA%
- F0%/NTZ' Bias: Price Neutral,
- MSFG Trend: Neutral.
YSFG Year 2026
- Long-Term
- YSFG Current: NA%
- F0%/NTZ' Bias: Price Below NTZ,
- YSFG Trend: Bearish.
Swing Pivots
- (Short-Term) 1. Pvt. Trend: DTrend,
- (Intermediate-Term) 2. HiLo Trend: DTrend,
- 3. Pvt. Evolve: Pvt low 354.67,
- 4. Pvt. Next: Pvt high 389.37,
- 5. Levels R: 509.70, 492.15, 429.42,
- 6. Levels S: 354.67, 291.78, 236.13, 211.54, 210.71, 168.30.
Weekly Benchmarks
- (Short-Term) 5 Day: 373.82 Down Trend,
- (Short-Term) 10 Day: 387.81 Down Trend,
- (Intermediate-Term) 20 Day: 386.46 Down Trend,
- (Intermediate-Term) 55 Day: 385.69 Down Trend,
- (Long-Term) 100 Day: 355.71 Down Trend,
- (Long-Term) 200 Day: 277.51 Up Trend.
Overall Rating
- Short-Term: Bearish,
- Intermediate-Term: Bearish,
- Long-Term: Bullish.
Key Insights Summary
GLD reflects a fast weekly liquidation leg from the 429.42 pivot-high area into the 354.67 pivot low, producing a short-term and intermediate-term lower-high/lower-low structure. Price is beneath the declining 5, 10, 20, and 55-week benchmarks and below the 2026 yearly NTZ, confirming counter-trend pressure within the broader advance. The 354.67 area aligns closely with the declining 100-week benchmark and is the immediate structural pivot; 389.37 is the reversal threshold for a new short-term pivot high. The 200-week benchmark remains upward-sloping well below price, preserving the longer-term bullish market structure despite the current weekly correction.
Chart Analysis ATS AI Generated: 2026-11-09 07:42 for Informational use only, not trading advice. Terms and Risk Disclosure Copyright © 2026. Algo Trading Systems LLC.