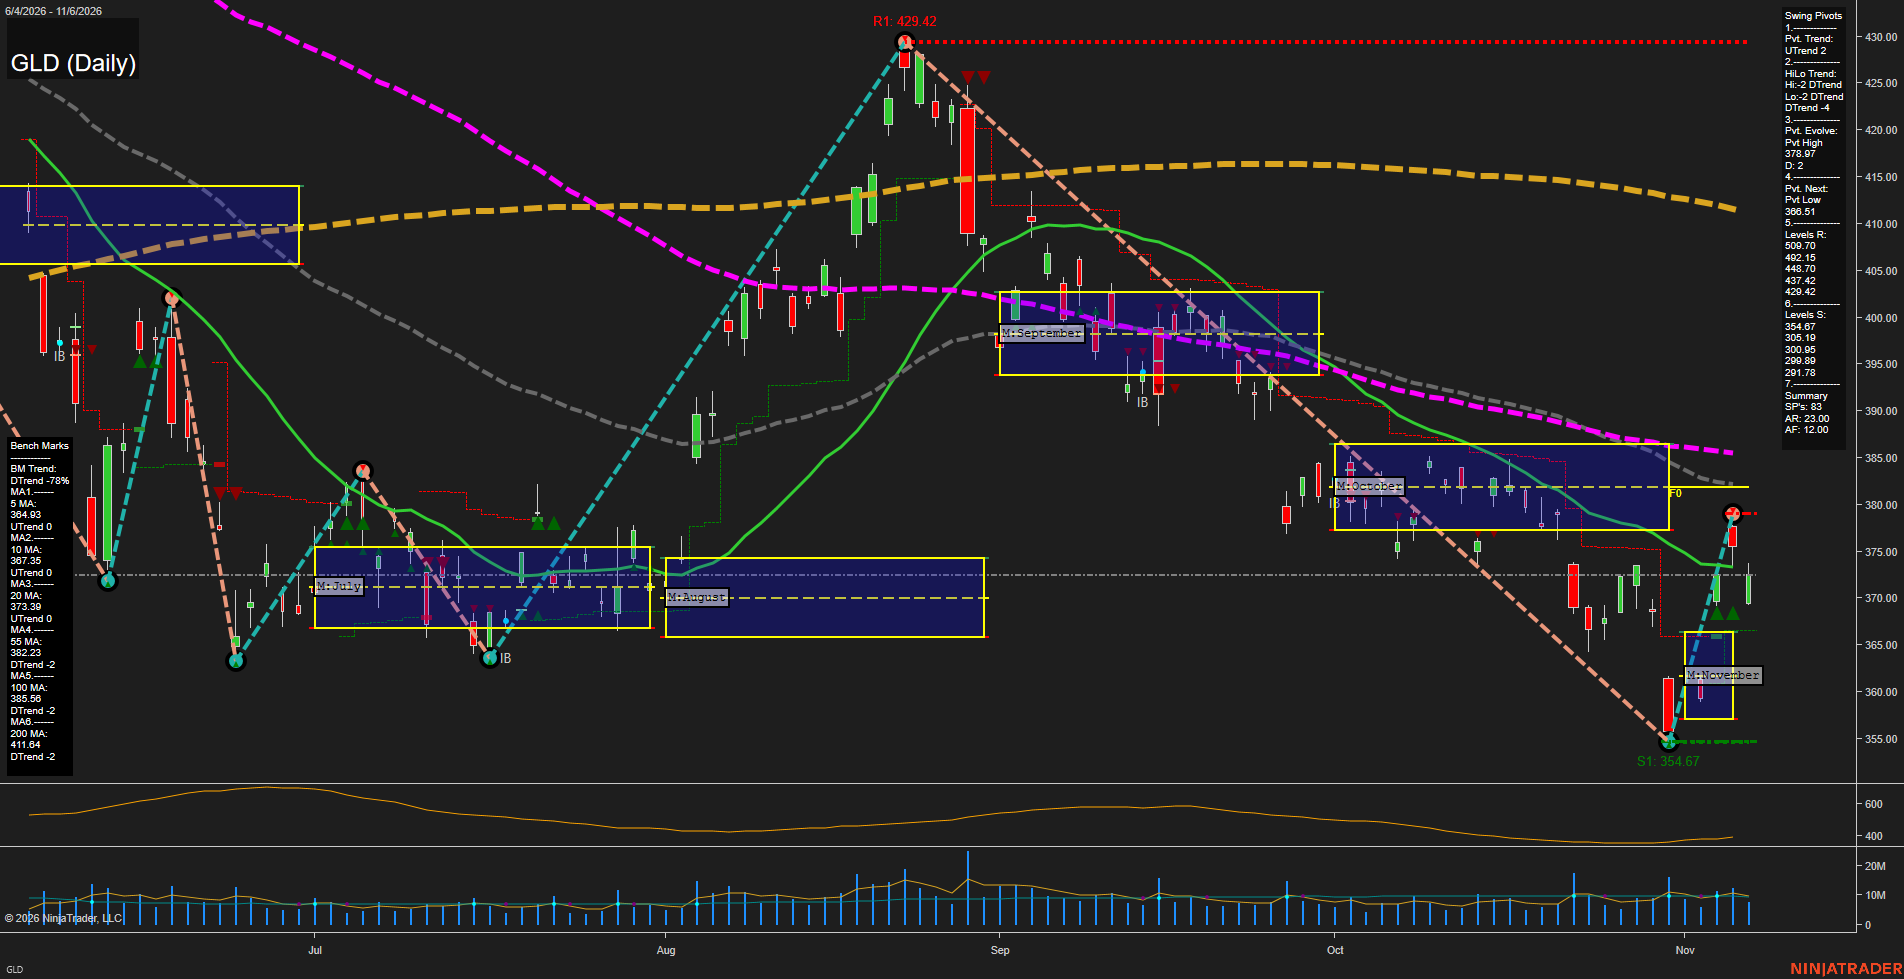
GLD SPDR Gold Shares Daily Chart Analysis: 2026-Nov-09 07:42 CT
Price Action
- Last: 370.10,
- Bars: Medium,
- Mom: Fast.
WSFG Weekly
- Short-Term
- WSFG Current: NA%
- F0%/NTZ' Bias: Price Neutral,
- WSFG Trend: Neutral.
MSFG Month Nov
- Intermediate-Term
- MSFG Current: 100%
- F0%/NTZ' Bias: Price Bullish,
- MSFG Trend: UTrend.
YSFG Year 2026
- Long-Term
- YSFG Current: NA%
- F0%/NTZ' Bias: Price Neutral,
- YSFG Trend: Neutral.
Swing Pivots
- (Short-Term) 1. Pvt. Trend: UTrend,
- (Intermediate-Term) 2. HiLo Trend: DTrend,
- 3. Pvt. Evolve: Pvt high 378.97,
- 4. Pvt. Next: Pvt low 368.51,
- 5. Levels R: 429.42, 409.70, 402.15, 398.70, 393.42,
- 6. Levels S: 365.19, 364.67, 360.85, 359.89, 354.67.
Daily Benchmarks
- (Short-Term) 5 Day: 364.93 Up Trend,
- (Short-Term) 10 Day: 367.35 Up Trend,
- (Intermediate-Term) 20 Day: 373.90 Up Trend,
- (Intermediate-Term) 55 Day: 382.23 Down Trend,
- (Long-Term) 100 Day: 385.56 Down Trend,
- (Long-Term) 200 Day: 411.64 Down Trend.
Additional Metrics
- ATR: 23.00,
- VOLMA: 12.00.
Overall Rating
- Short-Term: Bullish,
- Intermediate-Term: Bearish,
- Long-Term: Bearish.
Key Insights Summary
From a futures swing-trader perspective, the chart shows a sharp short-term recovery from the 354.67 swing low, producing an UTrend pivot structure and lifting price above the rising 5- and 10-day benchmarks. The rally reached 378.97 and then retraced toward the 368.51 pivot-reversal area, keeping near-term action active and volatile. Intermediate and long-term structure remains bearish because price is below the declining 55-, 100-, and 200-day benchmarks, while the HiLo pivot trend remains DTrend. The November monthly grid has shifted upward from its lower range, but the 373.90 to 382.23 benchmark zone remains a prominent overhead transition area. Support is clustered around 365.19 through 354.67, while the prior 378.97 swing high and higher resistance levels define the broader countertrend rally framework.
Chart Analysis ATS AI Generated: 2026-11-09 07:42 for Informational use only, not trading advice. Terms and Risk Disclosure Copyright © 2026. Algo Trading Systems LLC.