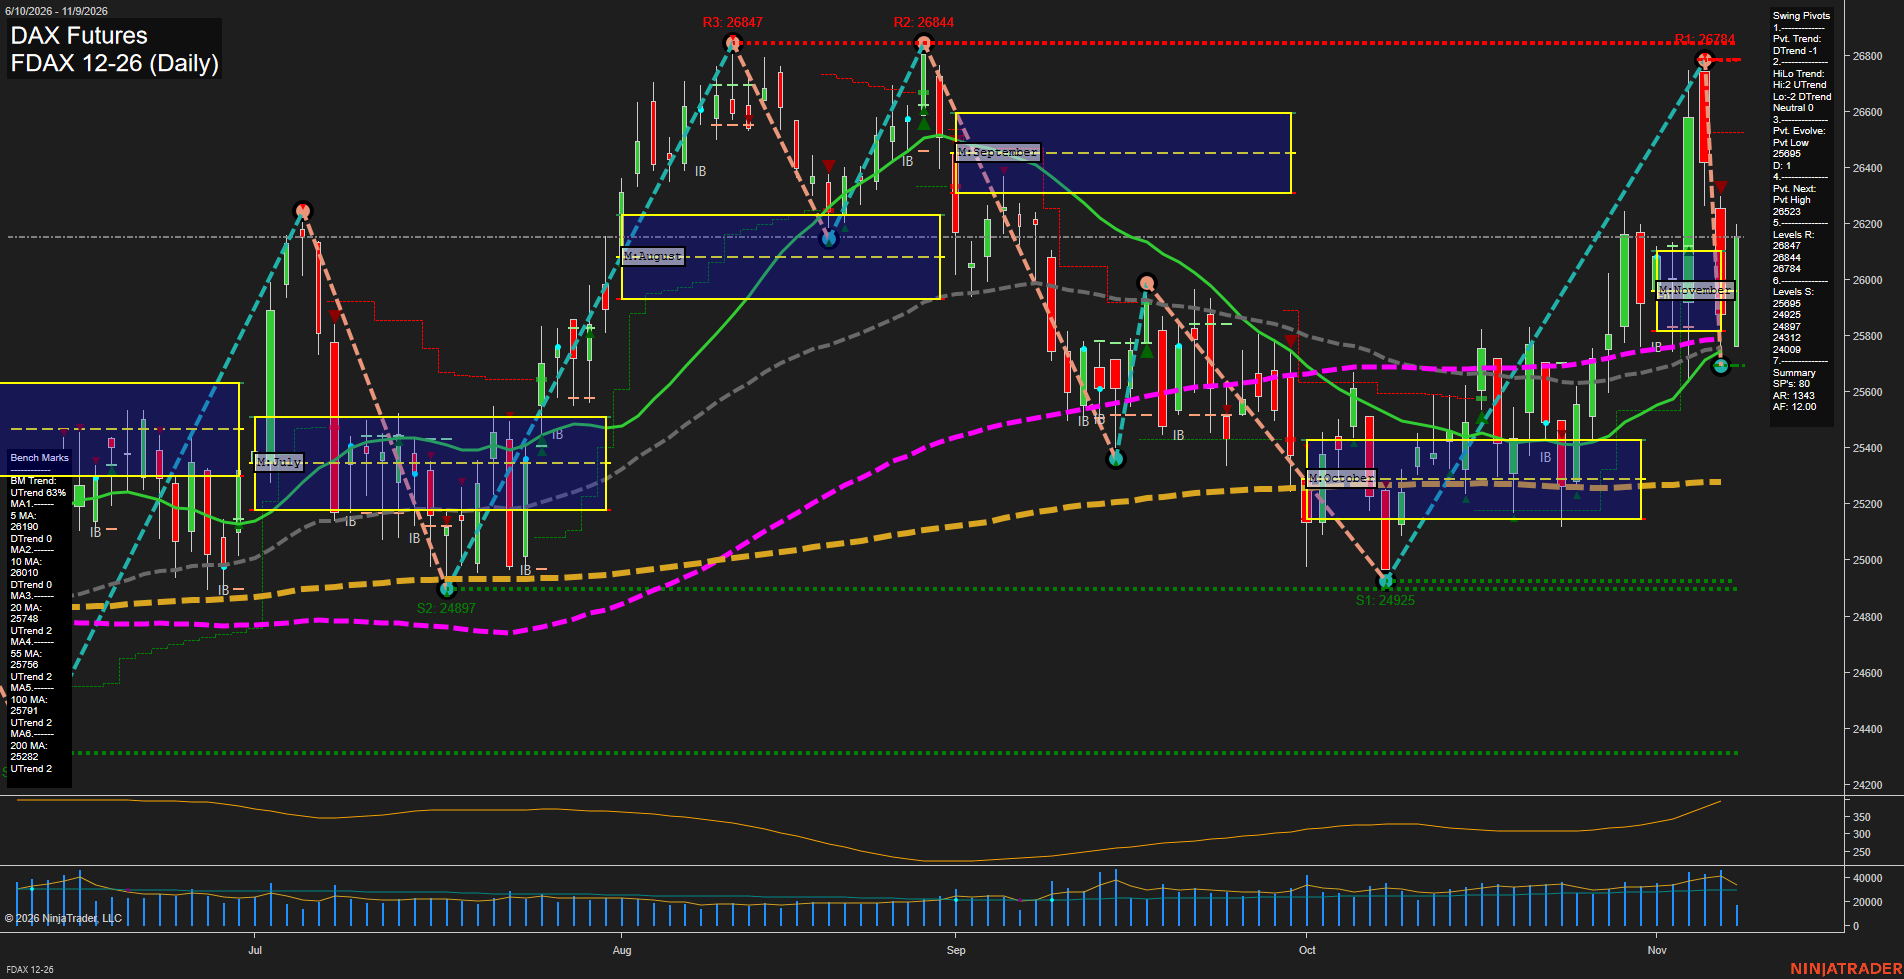
FDAX DAX Futures Daily Chart Analysis: 2026-Nov-09 07:41 CT
Price Action
- Last: 26110,
- Bars: Large,
- Mom: Fast.
WSFG Weekly
- Short-Term
- WSFG Current: 55%
- F0%/NTZ' Bias: Price Above,
- WSFG Trend: Up.
MSFG Month Nov
- Intermediate-Term
- MSFG Current: 24%
- F0%/NTZ' Bias: Price Above,
- MSFG Trend: Up.
YSFG Year 2026
- Long-Term
- YSFG Current: 34%
- F0%/NTZ' Bias: Price Above,
- YSFG Trend: Up.
Swing Pivots
- (Short-Term) 1. Pvt. Trend: DTrend,
- (Intermediate-Term) 2. HiLo Trend: UTrend,
- 3. Pvt. Evolve: Pvt low 25695,
- 4. Pvt. Next: Pvt high 26523,
- 5. Levels R: 26847, 26844, 26784,
- 6. Levels S: 25695, 24925, 24897, 24312, 24008.
Daily Benchmarks
- (Short-Term) 5 Day: 26190 Up Trend,
- (Short-Term) 10 Day: 26100 Down Trend,
- (Intermediate-Term) 20 Day: 25748 Up Trend,
- (Intermediate-Term) 55 Day: 25756 Up Trend,
- (Long-Term) 100 Day: 25791 Up Trend,
- (Long-Term) 200 Day: 25282 Up Trend.
Additional Metrics
Recent Trade Signals
- 06 Nov 2026: Short FDAX 12-26 @ 25803 Signals.USAR-MSFG
- 06 Nov 2026: Short FDAX 12-26 @ 25803 Signals.USAR-WSFG
Overall Rating
- Short-Term: Bearish,
- Intermediate-Term: Bullish,
- Long-Term: Bullish.
Key Insights Summary
FDAX remains above the rising 20-, 55-, 100-, and 200-day benchmarks, preserving the intermediate and major uptrend structure. Short-term price action is volatile and corrective after rejection from the 26784-26847 resistance cluster, with the pivot trend turning down despite the broader higher-low structure. The 25695 pivot-low area is the principal nearby support reference, while 26523 is the next pivot reversal threshold and 26784-26847 remains the major overhead supply zone. Large daily ranges and elevated ATR reflect a fast, two-sided post-rally consolidation rather than a smooth directional advance.
Chart Analysis ATS AI Generated: 2026-11-09 07:41 for Informational use only, not trading advice. Terms and Risk Disclosure Copyright © 2026. Algo Trading Systems LLC.