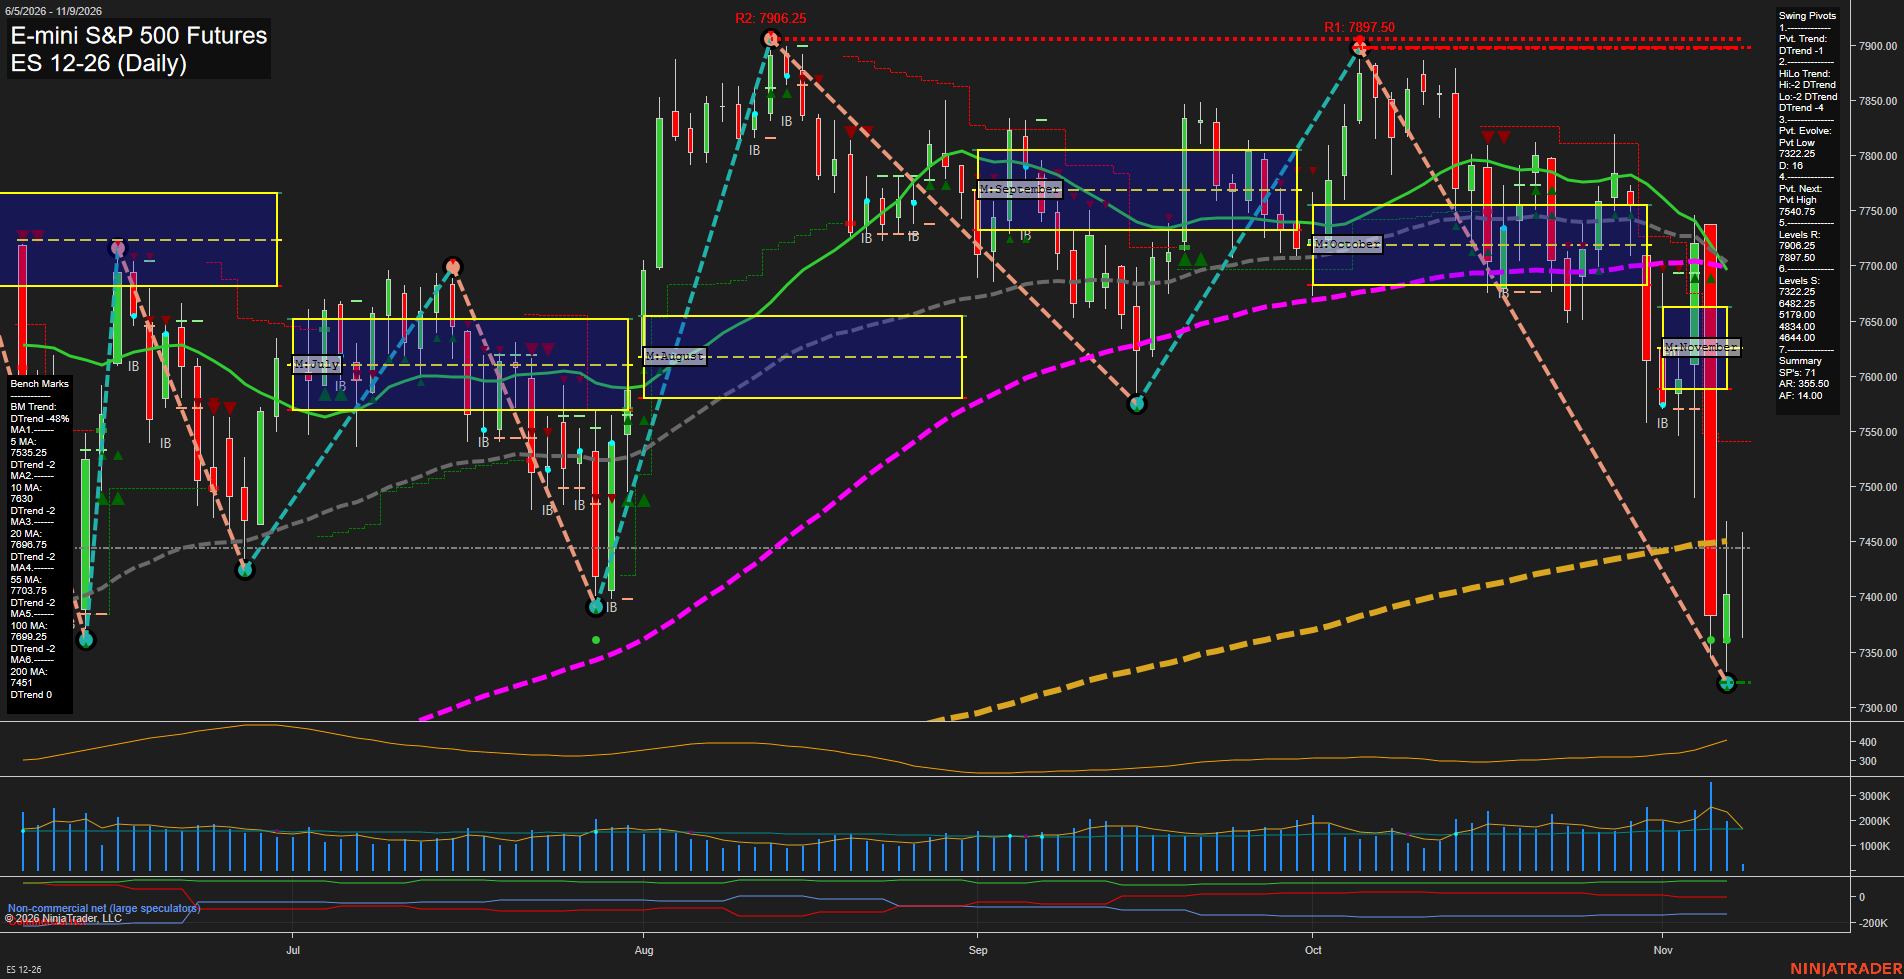
ES E-mini S&P 500 Futures Daily Chart Analysis: 2026-Nov-09 07:40 CT
Price Action
- Last: 7356.00,
- Bars: Large,
- Mom: Fast.
WSFG Weekly
- Short-Term
- WSFG Current: 36%
- F0%/NTZ' Bias: Price Above,
- WSFG Trend: Up.
MSFG Month Nov
- Intermediate-Term
- MSFG Current: -52%
- F0%/NTZ' Bias: Price Below,
- MSFG Trend: Down.
YSFG Year 2026
- Long-Term
- YSFG Current: 30%
- F0%/NTZ' Bias: Price Above,
- YSFG Trend: Up.
Swing Pivots
- (Short-Term) 1. Pvt. Trend: DTrend,
- (Intermediate-Term) 2. HiLo Trend: DTrend,
- 3. Pvt. Evolve: Pvt low 7325.00,
- 4. Pvt. Next: Pvt high 7540.75,
- 5. Levels R: 7906.25, 7897.50, 7697.50,
- 6. Levels S: 7522.25, 6482.25, 5179.00, 4834.00, 4644.00.
Daily Benchmarks
- (Short-Term) 5 Day: 7535.25 Down Trend,
- (Short-Term) 10 Day: 7630.00 Down Trend,
- (Intermediate-Term) 20 Day: 7698.75 Down Trend,
- (Intermediate-Term) 55 Day: 7703.75 Down Trend,
- (Long-Term) 100 Day: 7689.25 Down Trend,
- (Long-Term) 200 Day: 7451.00 Down Trend.
Additional Metrics
- ATR: 356.50,
- VOLMA: 2094903.
Recent Trade Signals
- 05 Nov 2026: Short ES 12-26 @ 7593.75 Signals.USAR-WSFG
- 04 Nov 2026: Long ES 12-26 @ 7674.75 Signals.USAR-MSFG
Overall Rating
- Short-Term: Bearish,
- Intermediate-Term: Bearish,
- Long-Term: Bearish.
Key Insights Summary
Price has undergone a high-volatility breakdown from the October highs, with large daily ranges and a decisive move beneath every displayed daily benchmark. The short-term weekly grid remains above its F0% level, reflecting an oversold countertrend bounce attempt, while the monthly grid remains negative and confirms the intermediate downtrend. Both pivot structures are in DTrend, with 7325.00 defining the active pivot low and 7540.75 the first pivot-reversal threshold. The rebound remains structurally weak below the clustered 5-day through 100-day averages, while the 200-day average near 7451.00 is now an important overhead reference. Increased ATR and elevated volume reflect an active liquidation-driven price cycle rather than orderly consolidation.
Chart Analysis ATS AI Generated: 2026-11-09 07:40 for Informational use only, not trading advice. Terms and Risk Disclosure Copyright © 2026. Algo Trading Systems LLC.