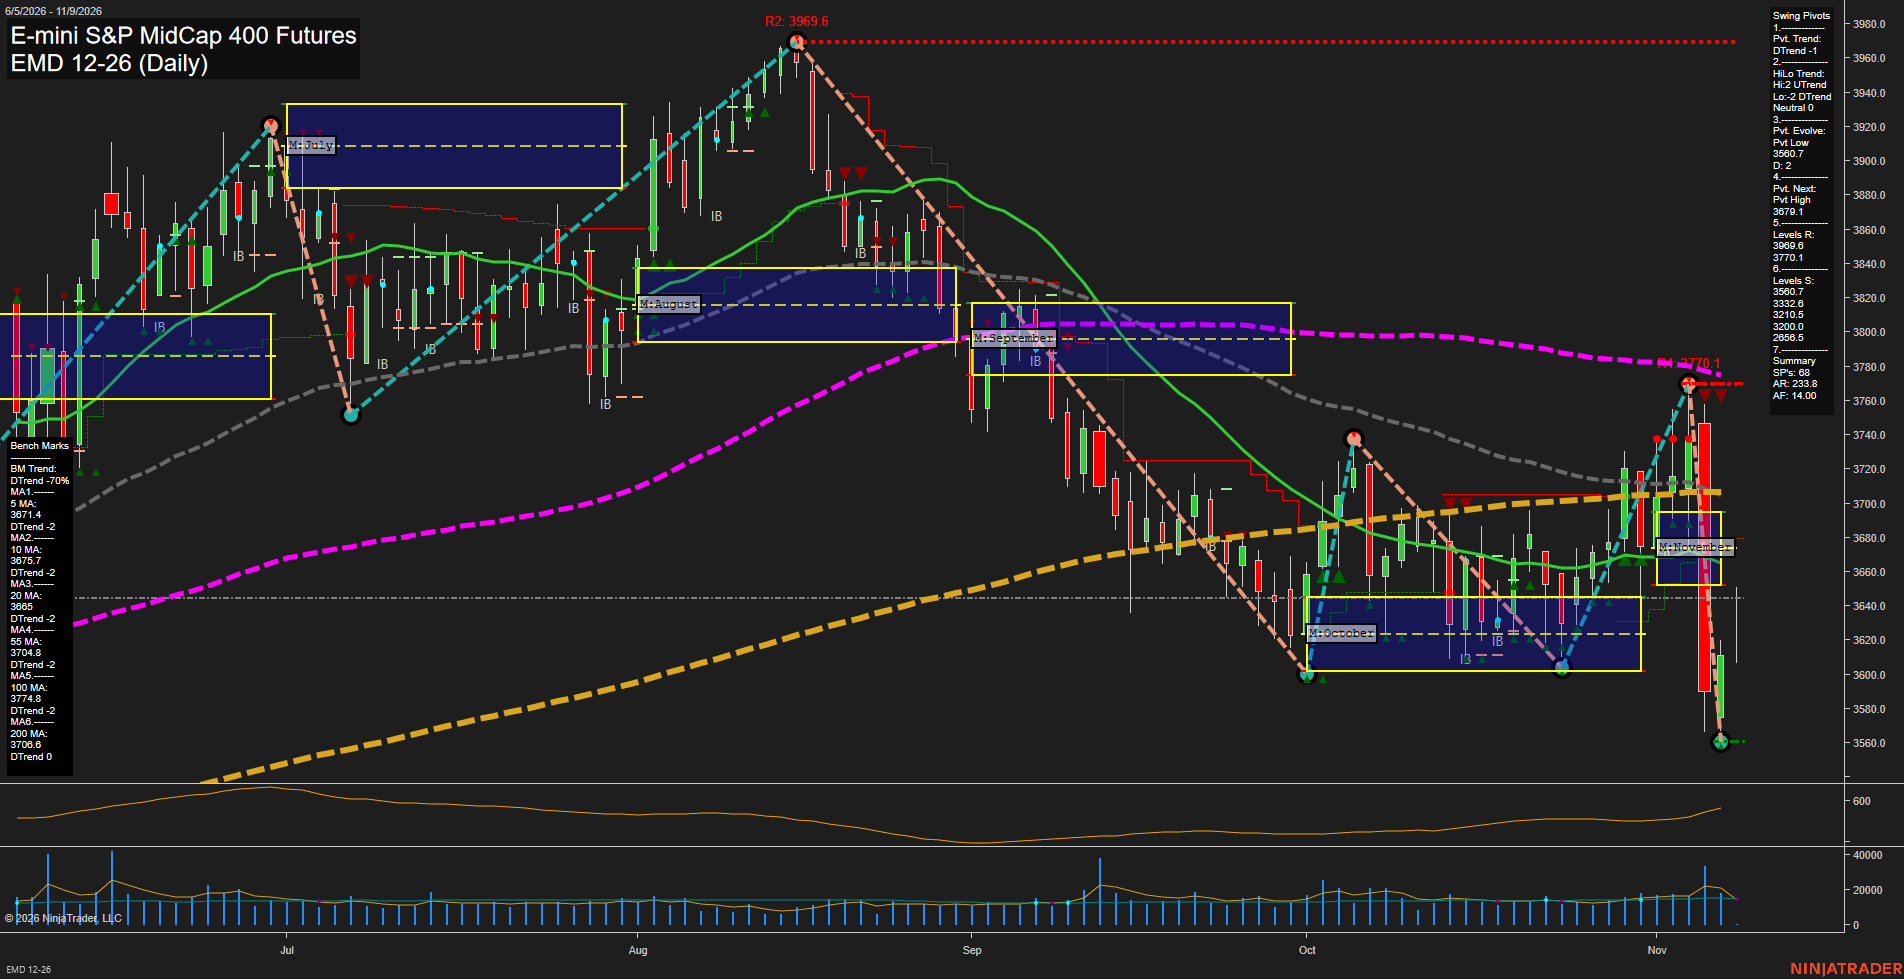
EMD E-mini S&P MidCap 400 Futures Daily Chart Analysis: 2026-Nov-09 07:39 CT
Price Action
- Last: 3560.7,
- Bars: Large,
- Mom: Fast.
WSFG Weekly
- Short-Term
- WSFG Current: 31%
- F0%/NTZ' Bias: Price Above,
- WSFG Trend: Up.
MSFG Month Nov
- Intermediate-Term
- MSFG Current: -14%
- F0%/NTZ' Bias: Price Below,
- MSFG Trend: Down.
YSFG Year 2026
- Long-Term
- YSFG Current: 29%
- F0%/NTZ' Bias: Price Above,
- YSFG Trend: Up.
Swing Pivots
- (Short-Term) 1. Pvt. Trend: DTrend,
- (Intermediate-Term) 2. HiLo Trend: UTrend,
- 3. Pvt. Evolve: Pvt low 3560.7,
- 4. Pvt. Next: Pvt high 3697.1,
- 5. Levels R: 3696.9, 3770.1,
- 6. Levels S: 3560.7, 3332.6, 3210.5, 3200.0, 2565.5.
Daily Benchmarks
- (Short-Term) 5 Day: 3671.4 Down Trend,
- (Short-Term) 10 Day: 3675.7 Down Trend,
- (Intermediate-Term) 20 Day: 3685.9 Down Trend,
- (Intermediate-Term) 55 Day: 3704.8 Down Trend,
- (Long-Term) 100 Day: 3774.2 Down Trend,
- (Long-Term) 200 Day: 3706.6 Down Trend.
Additional Metrics
Recent Trade Signals
- 09 Nov 2026: Long EMD 12-26 @ 3625 Signals.USAR-WSFG
- 03 Nov 2026: Long EMD 12-26 @ 3702.5 Signals.USAR-MSFG
Overall Rating
- Short-Term: Bearish,
- Intermediate-Term: Bearish,
- Long-Term: Neutral.
Key Insights Summary
Price action has shifted into a sharp, high-momentum selloff, with large daily bars driving EMD beneath every tracked benchmark average. The short-term pivot structure is in a DTrend and the November MSFG remains below its F0% level, confirming the intermediate-term countertrend decline. The 3560.7 pivot-low support is the immediate focal level after the rapid rejection from the 3770 area; 3696.9 and 3770.1 define the nearby overhead pivot resistance zone. The broader yearly grid remains positive and the HiLo structure retains an UTrend classification, creating a longer-cycle contrast against the current bearish daily momentum. Elevated ATR behavior reflects an expanded volatility regime rather than a quiet consolidation phase.
Chart Analysis ATS AI Generated: 2026-11-09 07:40 for Informational use only, not trading advice. Terms and Risk Disclosure Copyright © 2026. Algo Trading Systems LLC.