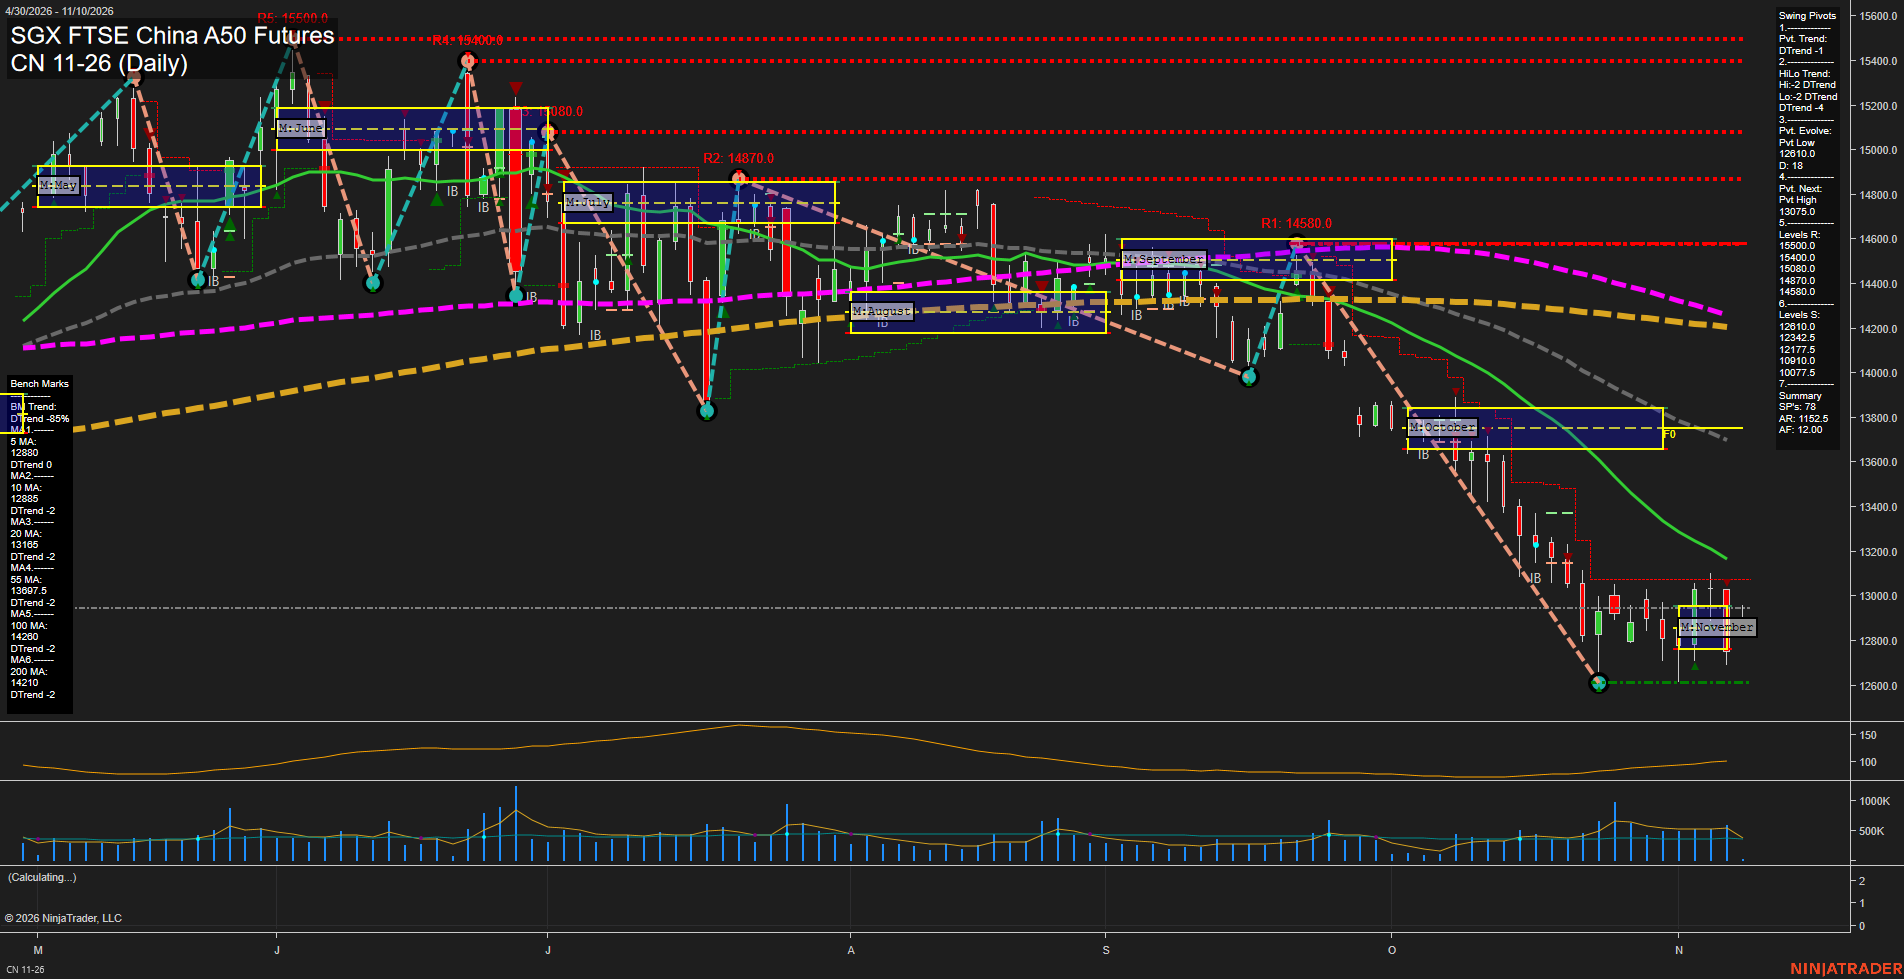
CN SGX FTSE China A50 Futures Daily Chart Analysis: 2026-Nov-09 07:39 CT
Price Action
- Last: 12900,
- Bars: Small,
- Mom: Slow.
WSFG Weekly
- Short-Term
- WSFG Current: NA%
- F0%/NTZ' Bias: Price Neutral,
- WSFG Trend: Neutral.
MSFG Month Nov
- Intermediate-Term
- MSFG Current: NA%
- F0%/NTZ' Bias: Price Above F0%,
- MSFG Trend: Bullish.
YSFG Year 2026
- Long-Term
- YSFG Current: NA%
- F0%/NTZ' Bias: Price Neutral,
- YSFG Trend: Neutral.
Swing Pivots
- (Short-Term) 1. Pvt. Trend: DTrend,
- (Intermediate-Term) 2. HiLo Trend: DTrend,
- 3. Pvt. Evolve: Pvt low 12610,
- 4. Pvt. Next: Pvt high 13075,
- 5. Levels R: 15500, 15400, 15080, 14900, 14580,
- 6. Levels S: 12610, 12342.5, 12177.5, 10910, 10077.5.
Daily Benchmarks
- (Short-Term) 5 Day: 12880 Down Trend,
- (Short-Term) 10 Day: 12885 Down Trend,
- (Intermediate-Term) 20 Day: 13165 Down Trend,
- (Intermediate-Term) 55 Day: 13697.5 Down Trend,
- (Long-Term) 100 Day: 14280 Down Trend,
- (Long-Term) 200 Day: 14210 Down Trend.
Additional Metrics
- ATR: 1152.5,
- VOLMA: 532210.
Overall Rating
- Short-Term: Bearish,
- Intermediate-Term: Bearish,
- Long-Term: Bearish.
Key Insights Summary
Price is consolidating near 12900 after a sharp October-to-November selloff and a test of the 12610 swing-low support. Small recent bars and slow momentum reflect a pause or base-building phase rather than a confirmed reversal. The short-term pivot structure remains DTrend, with 13075 defining the next pivot-high reversal threshold, while price remains beneath the declining 20, 55, 100, and 200-day benchmarks. The November MSFG position is above its F0% line, showing an internal monthly bounce, but the broader technical structure remains characterized by lower highs, lower lows, and overhead resistance beginning at 13165 and extending toward 13697.5.
Chart Analysis ATS AI Generated: 2026-11-09 07:39 for Informational use only, not trading advice. Terms and Risk Disclosure Copyright © 2026. Algo Trading Systems LLC.