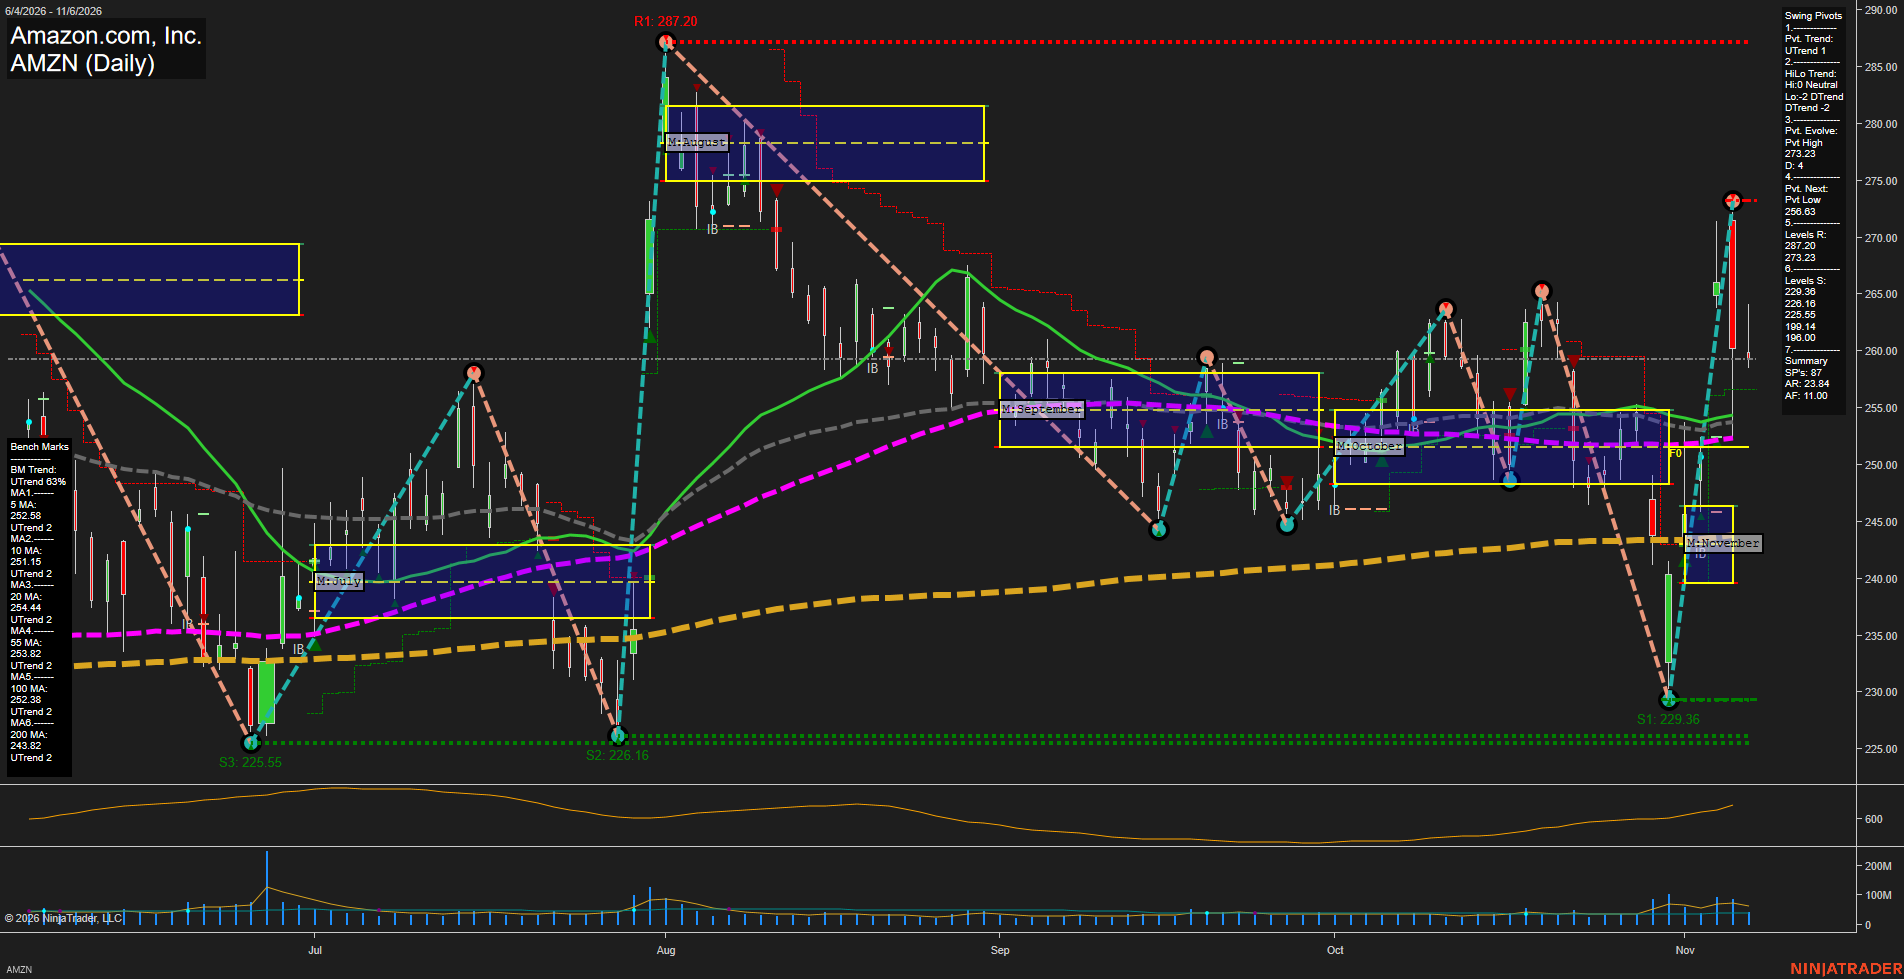
AMZN Amazon.com; Inc. Daily Chart Analysis: 2026-Nov-09 07:37 CT
Price Action
- Last: 259.00,
- Bars: Large,
- Mom: Fast.
WSFG Weekly
- Short-Term
- WSFG Current: NA%
- F0%/NTZ' Bias: Price Neutral,
- WSFG Trend: Neutral.
MSFG Month Nov
- Intermediate-Term
- MSFG Current: NA%
- F0%/NTZ' Bias: Price Bullish,
- MSFG Trend: Bullish.
YSFG Year 2026
- Long-Term
- YSFG Current: NA%
- F0%/NTZ' Bias: Price Neutral,
- YSFG Trend: Neutral.
Swing Pivots
- (Short-Term) 1. Pvt. Trend: UTrend,
- (Intermediate-Term) 2. HiLo Trend: DTrend,
- 3. Pvt. Evolve: Pvt high 273.23,
- 4. Pvt. Next: Pvt low 258.63,
- 5. Levels R: 287.20, 273.23,
- 6. Levels S: 229.36, 228.16, 225.55, 199.14, 198.00.
Daily Benchmarks
- (Short-Term) 5 Day: 252.58 Up Trend,
- (Short-Term) 10 Day: 251.15 Up Trend,
- (Intermediate-Term) 20 Day: 254.42 Up Trend,
- (Intermediate-Term) 55 Day: 253.83 Up Trend,
- (Long-Term) 100 Day: 252.38 Up Trend,
- (Long-Term) 200 Day: 243.82 Up Trend.
Additional Metrics
- ATR: 465,
- VOLMA: 33608198.
Overall Rating
- Short-Term: Bullish,
- Intermediate-Term: Bullish,
- Long-Term: Bullish.
Key Insights Summary
AMZN remains in a broad bullish benchmark structure, with price above all listed moving averages and the 200-day average materially below the current market. From a futures swing-trading perspective, the short-term pivot sequence remains upward, but the latest large red daily bar reflects a sharp rejection from the 272.30 to 273.23 pivot-high area following a fast rally from the 229.36 low. Price is testing the 258.63 pivot-reversal level, making this area the near-term divider between continuation of the rebound and a renewed pullback into the clustered 20-, 55-, and 100-day averages near 252 to 254. The November MSFG position remains bullish because price is above its NTZ range, while the intermediate HiLo pivot structure remains less constructive after the prior lower-high sequence. Resistance is concentrated at 273.23 and 287.20; major swing support begins at 229.36 to 225.55. Elevated range expansion and the recent reversal bar indicate a volatile, momentum-driven market rather than a low-volatility consolidation.
Chart Analysis ATS AI Generated: 2026-11-09 07:38 for Informational use only, not trading advice. Terms and Risk Disclosure Copyright © 2026. Algo Trading Systems LLC.