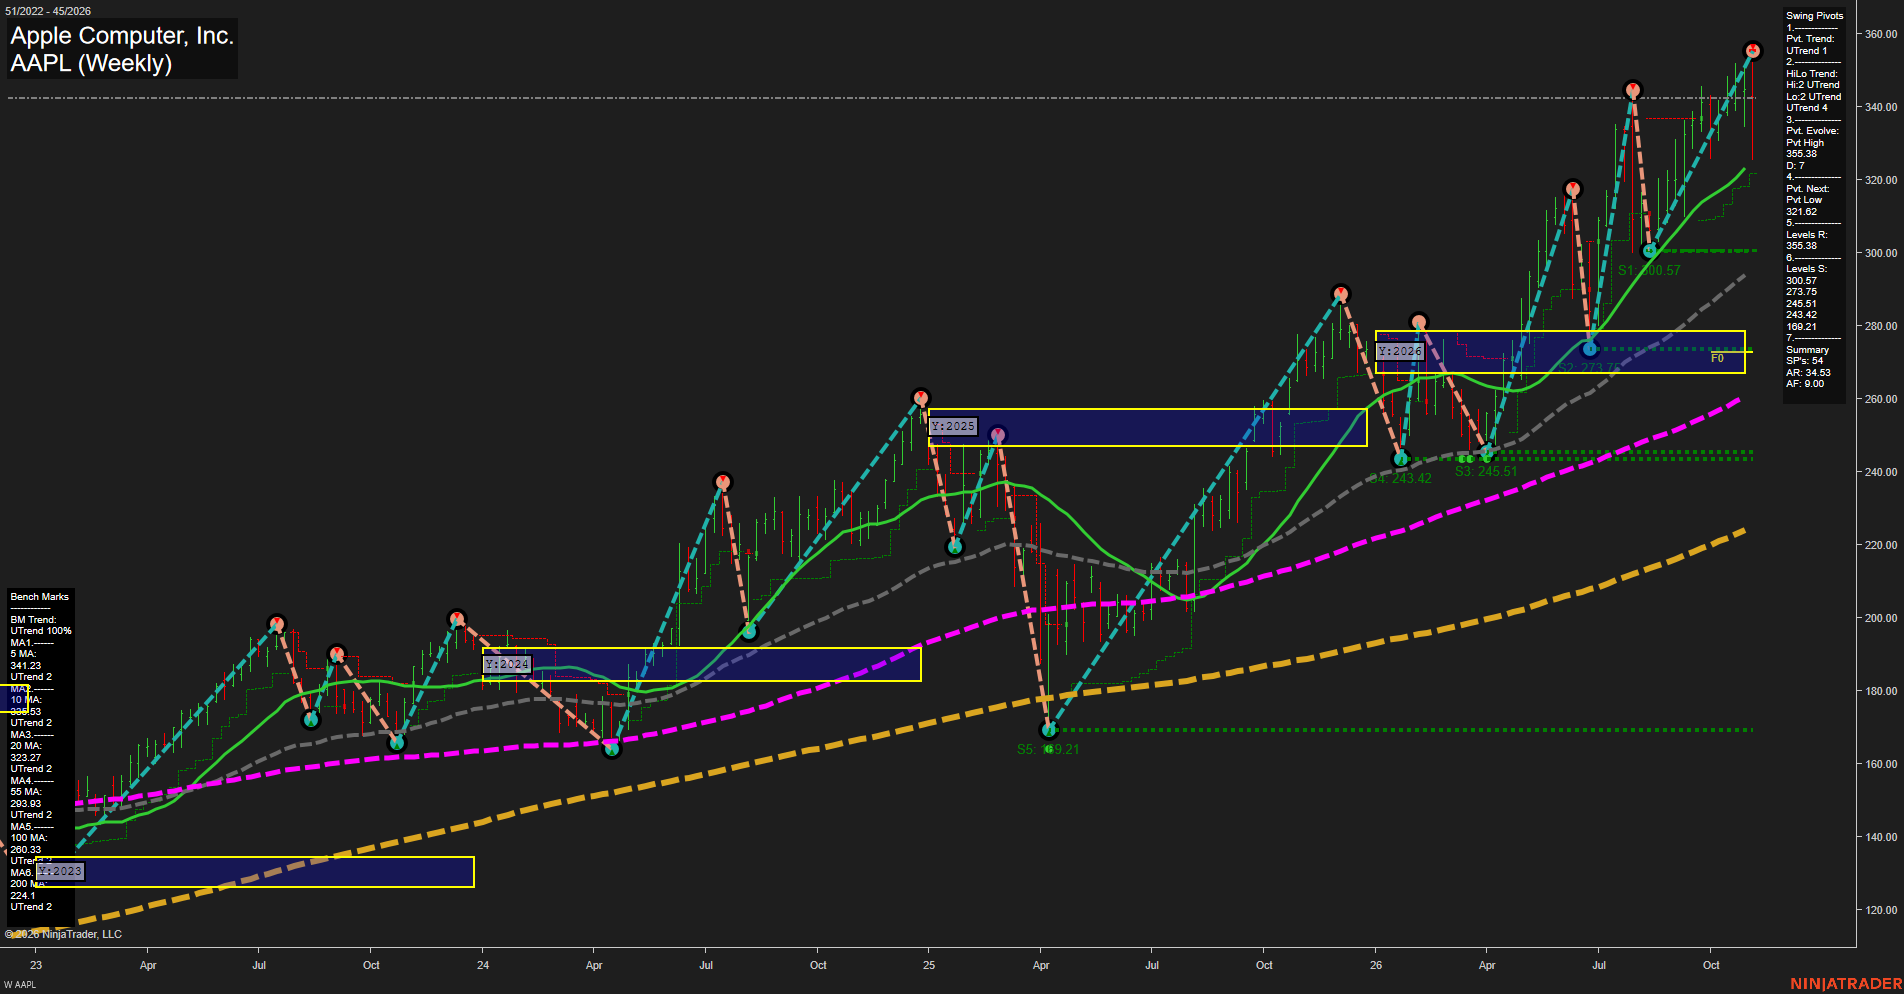
AAPL Apple Computer; Inc. Weekly Chart Analysis: 2026-Nov-09 07:37 CT
Price Action
- Last: 355.38,
- Bars: Large,
- Mom: fast.
WSFG Weekly
- Short-Term
- WSFG Current: NA%
- F0%/NTZ' Bias: Price Above NTZ,
- WSFG Trend: Bullish.
MSFG Month Nov
- Intermediate-Term
- MSFG Current: NA%
- F0%/NTZ' Bias: Price Above NTZ,
- MSFG Trend: Bullish.
YSFG Year 2026
- Long-Term
- YSFG Current: NA%
- F0%/NTZ' Bias: Price Above NTZ,
- YSFG Trend: Bullish.
Swing Pivots
- (Short-Term) 1. Pvt. Trend: UTrend,
- (Intermediate-Term) 2. HiLo Trend: UTrend,
- 3. Pvt. Evolve: Pvt high 355.38,
- 4. Pvt. Next: Pvt low 321.62,
- 5. Levels R: 355.38,
- 6. Levels S: 300.57, 273.75, 245.51, 243.42, 169.21.
Weekly Benchmarks
- (Short-Term) 5 Day: 341.42 Up Trend,
- (Short-Term) 10 Day: 335.53 Up Trend,
- (Intermediate-Term) 20 Day: 323.27 Up Trend,
- (Intermediate-Term) 55 Day: 293.93 Up Trend,
- (Long-Term) 100 Day: 260.33 Up Trend,
- (Long-Term) 200 Day: 224.18 Up Trend.
Overall Rating
- Short-Term: Bullish,
- Intermediate-Term: Bullish,
- Long-Term: Bullish.
Key Insights Summary
AAPL is in a broad weekly expansion phase, with price at the active 355.38 pivot-high resistance and materially above the rising 5, 10, 20, 55, 100, and 200-period benchmarks. From a futures swing-trader perspective, momentum is fast and volatility has expanded as the market advances through successive higher highs and higher lows. The nearest structural pivot reversal reference is 321.62, while 300.57 is the more significant prior swing-support area. The yearly Fib grid is well below current price, confirming an extended bullish condition rather than a balanced NTZ environment; this leaves the current action characterized by trend continuation and elevated extension from intermediate-term mean levels.
Chart Analysis ATS AI Generated: 2026-11-09 07:37 for Informational use only, not trading advice. Terms and Risk Disclosure Copyright © 2026. Algo Trading Systems LLC.