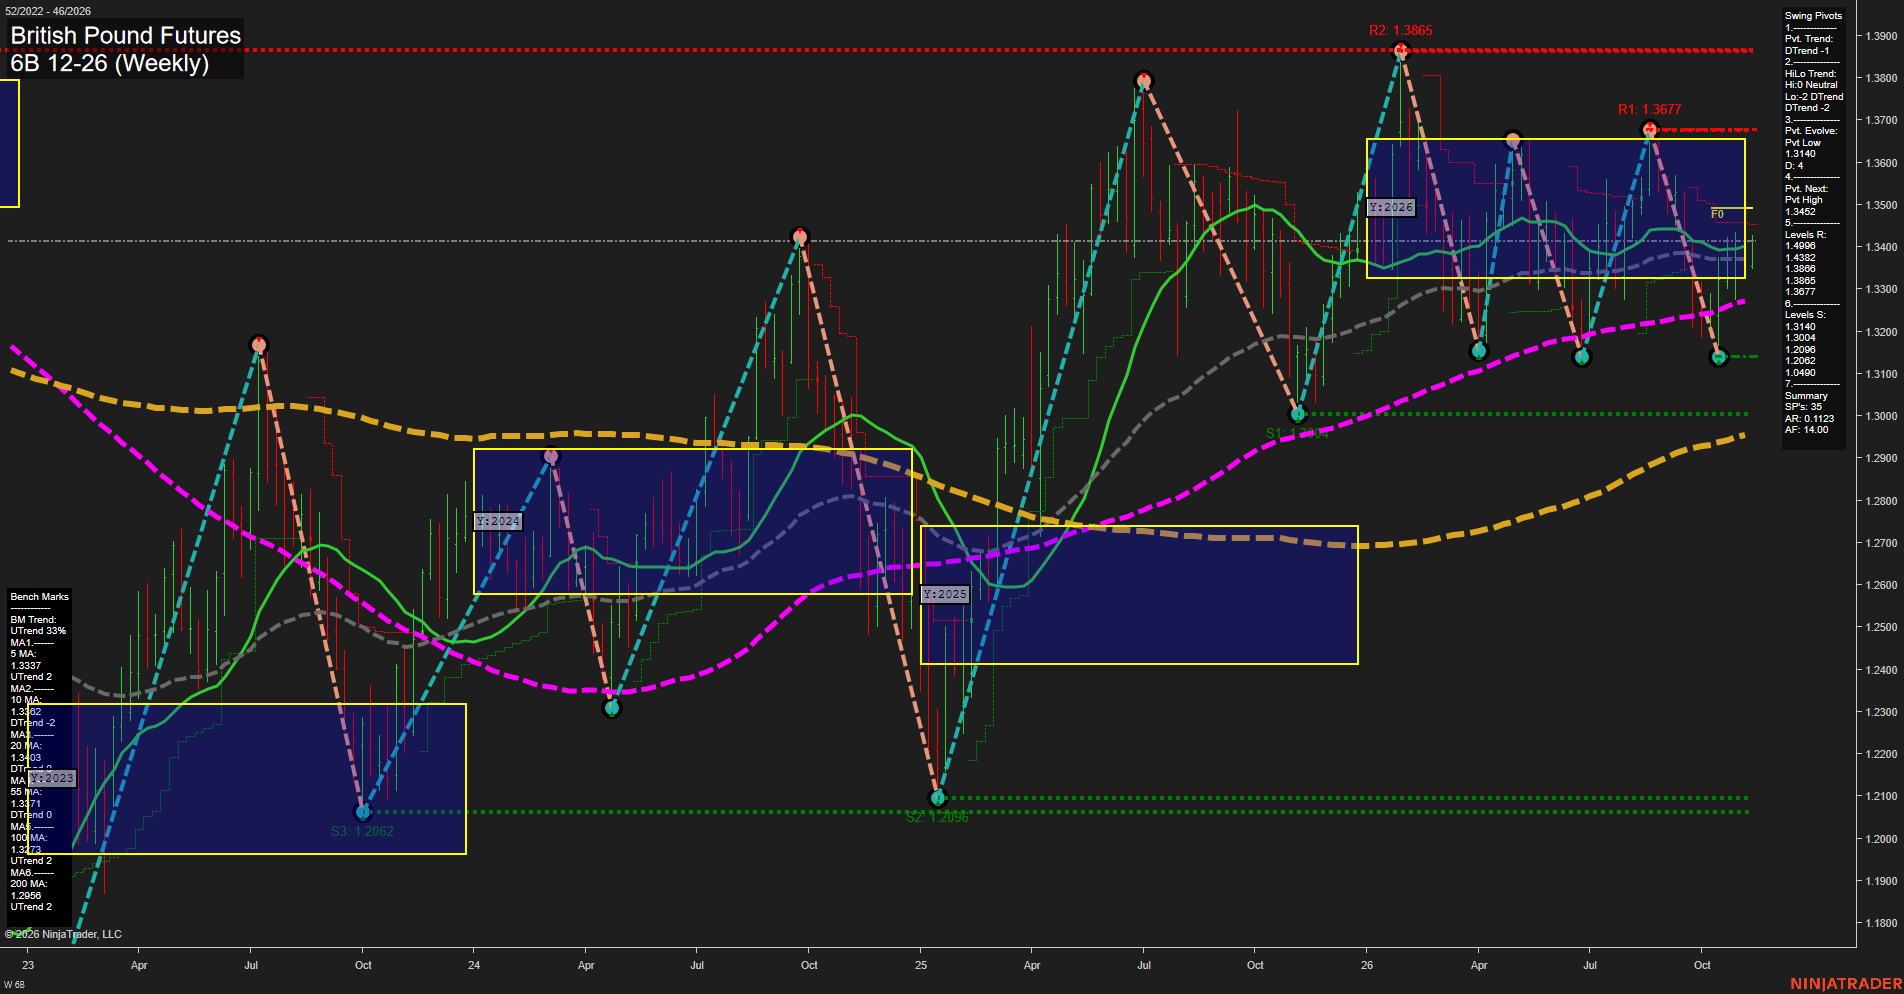
6B British Pound Futures Weekly Chart Analysis: 2026-Nov-09 07:36 CT
Price Action
- Last: 1.3405,
- Bars: Medium,
- Mom: Average.
WSFG Weekly
- Short-Term
- WSFG Current: 39%
- F0%/NTZ' Bias: Price Above,
- WSFG Trend: Up.
MSFG Month Nov
- Intermediate-Term
- MSFG Current: 9%
- F0%/NTZ' Bias: Price Above,
- MSFG Trend: Up.
YSFG Year 2026
- Long-Term
- YSFG Current: -4%
- F0%/NTZ' Bias: Price Below,
- YSFG Trend: Down.
Swing Pivots
- (Short-Term) 1. Pvt. Trend: DTrend,
- (Intermediate-Term) 2. HiLo Trend: DTrend,
- 3. Pvt. Evolve: Pvt low 1.3140,
- 4. Pvt. Next: Pvt high 1.3452,
- 5. Levels R: 1.4382, 1.3806, 1.3677, 1.3496,
- 6. Levels S: 1.3140, 1.3004, 1.2986, 1.2062.
Weekly Benchmarks
- (Short-Term) 5 Day: 1.3337 Up Trend,
- (Short-Term) 10 Day: 1.3362 Down Trend,
- (Intermediate-Term) 20 Day: 1.3403 Down Trend,
- (Intermediate-Term) 55 Day: 1.3371 Down Trend,
- (Long-Term) 100 Day: 1.3273 Up Trend,
- (Long-Term) 200 Day: 1.2858 Up Trend.
Recent Trade Signals
- 09 Nov 2026: Long 6B 12-26 @ 1.342 Signals.USAR.TR120
- 06 Nov 2026: Short 6B 12-26 @ 1.336 Signals.USAR-WSFG
- 04 Nov 2026: Long 6B 12-26 @ 1.3462 Signals.USAR-MSFG
Overall Rating
- Short-Term: Neutral,
- Intermediate-Term: Neutral,
- Long-Term: Neutral.
Key Insights Summary
The weekly structure shows a rebound from the 1.3140 pivot low, with price recovering above the weekly and monthly Fib-grid centers and holding near the 20-week benchmark at 1.3403. Short-term pivot structure remains down, however, because the latest confirmed swing sequence contains a lower high at 1.3677 and a newly evolving pivot low. The 1.3452 pivot-next level is the immediate structural inflection, while 1.3496, 1.3677, and 1.3806 define successive overhead resistance. The broader picture is mixed: monthly conditions remain positive and the 100- and 200-week averages rise beneath price, while the yearly Fib-grid position remains below its F0% level and the intermediate swing HiLo trend is down. This creates a corrective, range-like weekly environment between 1.3140 support and the 1.3452 to 1.3677 resistance band.
Chart Analysis ATS AI Generated: 2026-11-09 07:36 for Informational use only, not trading advice. Terms and Risk Disclosure Copyright © 2026. Algo Trading Systems LLC.