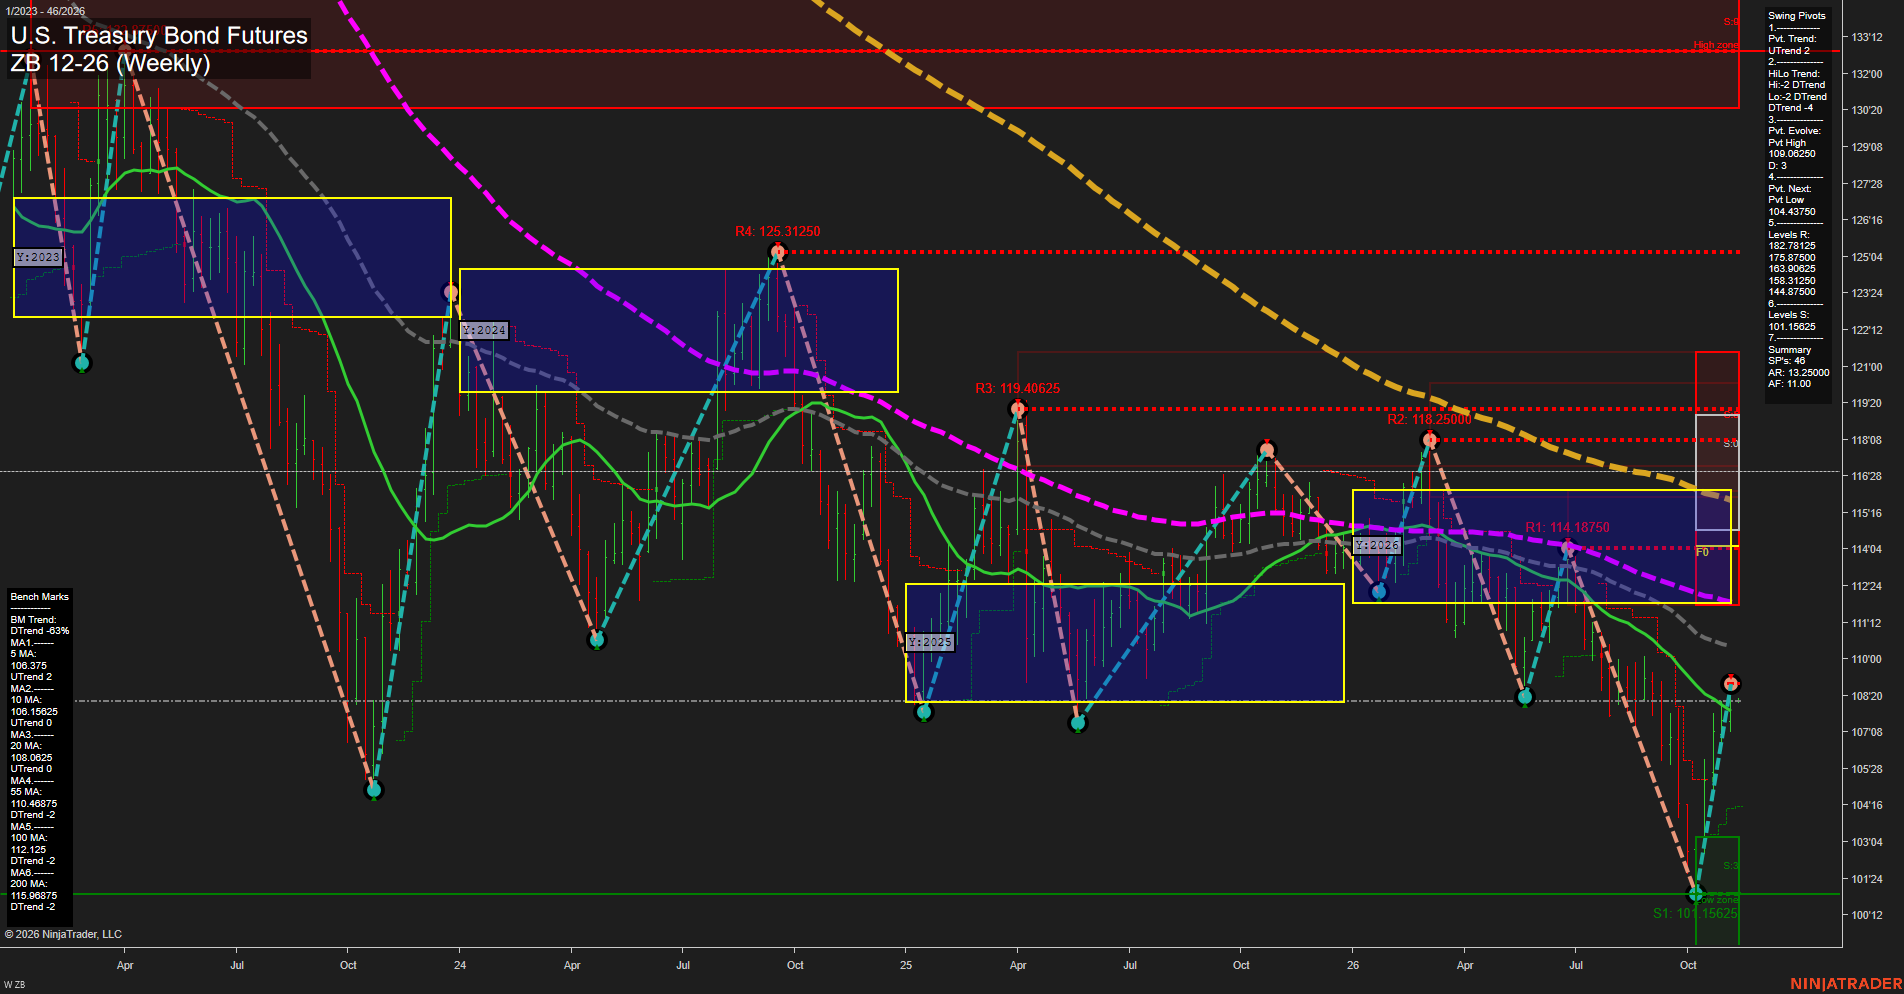
ZB U.S. Treasury Bond Futures Weekly Chart Analysis: 2026-Nov-08 18:11 CT
Price Action
- Last: 108'20,
- Bars: Large,
- Mom: Fast.
WSFG Weekly
- Short-Term
- WSFG Current: 6%
- F0%/NTZ' Bias: Price Above,
- WSFG Trend: Up.
MSFG Month Nov
- Intermediate-Term
- MSFG Current: 77%
- F0%/NTZ' Bias: Price Above,
- MSFG Trend: Up.
YSFG Year 2026
- Long-Term
- YSFG Current: -39%
- F0%/NTZ' Bias: Price Below,
- YSFG Trend: Down.
Swing Pivots
- (Short-Term) 1. Pvt. Trend: UTrend,
- (Intermediate-Term) 2. HiLo Trend: DTrend,
- 3. Pvt. Evolve: Pvt high 109.6250,
- 4. Pvt. Next: Pvt low 104.3750,
- 5. Levels R: 182.8125, 175.8750, 163.90625, 158.3125, 144.8750,
- 6. Levels S: 101.5625.
Weekly Benchmarks
- (Short-Term) 5 Day: 106.375 Up Trend,
- (Short-Term) 10 Day: 106.15625 Up Trend,
- (Intermediate-Term) 20 Day: 108.0625 Up Trend,
- (Intermediate-Term) 55 Day: 110.46875 Down Trend,
- (Long-Term) 100 Day: 112.125 Down Trend,
- (Long-Term) 200 Day: 115.96875 Down Trend.
Overall Rating
- Short-Term: Bullish,
- Intermediate-Term: Neutral,
- Long-Term: Bearish.
Key Insights Summary
Price has produced a sharp V-style recovery from the 101'24 area and is holding above the weekly F0% region, with fast upside momentum and short-term pivot structure improving. The rebound has lifted price above the 5-, 10-, and 20-week benchmarks, while the 55-, 100-, and 200-week averages remain overhead and retain declining trends. The intermediate structure remains mixed: monthly grid positioning is positive, but the HiLo pivot trend remains down and the evolving pivot high at 109'20 to 109'25 defines nearby recovery friction. The broader yearly structure remains bearish below its F0%/NTZ zone, framing the current advance as a strong countertrend recovery within a longer-term decline.
Chart Analysis ATS AI Generated: 2026-11-08 18:11 for Informational use only, not trading advice. Terms and Risk Disclosure Copyright © 2026. Algo Trading Systems LLC.