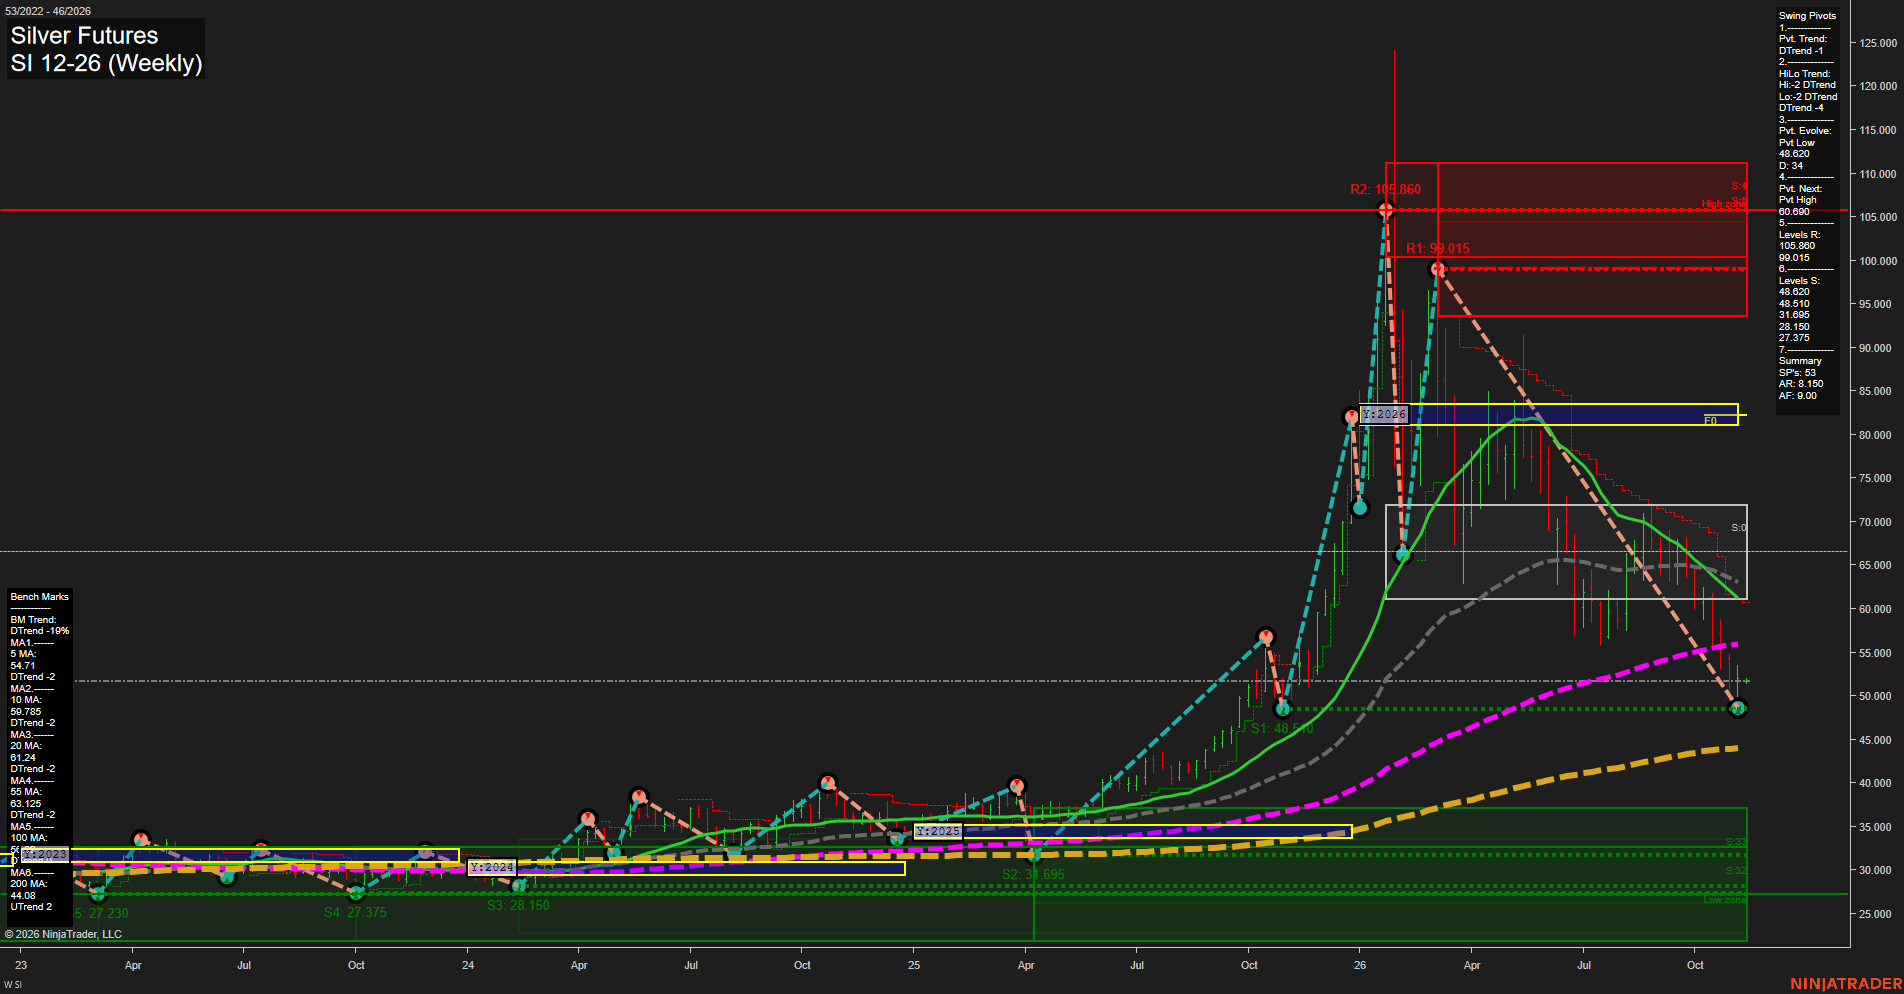
SI Silver Futures Weekly Chart Analysis: 2026-Nov-08 18:08 CT
Price Action
- Last: 51.202,
- Bars: Large,
- Mom: fast.
WSFG Weekly
- Short-Term
- WSFG Current: 4%
- F0%/NTZ' Bias: Price Above,
- WSFG Trend: Up.
MSFG Month Nov
- Intermediate-Term
- MSFG Current: 23%
- F0%/NTZ' Bias: Price Above,
- MSFG Trend: Up.
YSFG Year 2026
- Long-Term
- YSFG Current: -255%
- F0%/NTZ' Bias: Price Below,
- YSFG Trend: Down.
Swing Pivots
- (Short-Term) 1. Pvt. Trend: DTrend,
- (Intermediate-Term) 2. HiLo Trend: DTrend,
- 3. Pvt. Evolve: Pvt low 48.620,
- 4. Pvt. Next: Pvt high 60.690,
- 5. Levels R: 105.860, 99.015,
- 6. Levels S: 48.620, 48.510, 31.695, 28.150, 27.375, 27.230.
Weekly Benchmarks
- (Short-Term) 5 Day: 54.747 Down Trend,
- (Short-Term) 10 Day: 59.785 Down Trend,
- (Intermediate-Term) 20 Day: 61.204 Down Trend,
- (Intermediate-Term) 55 Day: 63.125 Down Trend,
- (Long-Term) 100 Day: 56.800 Up Trend,
- (Long-Term) 200 Day: 44.000 Up Trend.
Recent Trade Signals
- 04 Nov 2026: Long SI 12-26 @ 51.815 Signals.USAR-MSFG
- 04 Nov 2026: Long SI 12-26 @ 49.895 Signals.USAR-WSFG
Overall Rating
- Short-Term: Bearish,
- Intermediate-Term: Bearish,
- Long-Term: Bearish.
Key Insights Summary
Silver remains in a high-volatility corrective phase following the prior explosive advance. Price is holding just above the 48.620 and 48.510 swing-support cluster, while the current pivot structure remains bearish with lower highs and declining short- through intermediate-term benchmarks. The weekly and monthly fib grids retain an upward bias, reflected by the recent long signals, but price remains below the 5, 10, 20, 55, and 100 day benchmarks. The yearly grid is decisively below its F0% area and remains in a long-term down phase; 60.690 is the defined upside pivot-reversal level, while 48.620 is the immediate structural support reference.
Chart Analysis ATS AI Generated: 2026-11-08 18:08 for Informational use only, not trading advice. Terms and Risk Disclosure Copyright © 2026. Algo Trading Systems LLC.