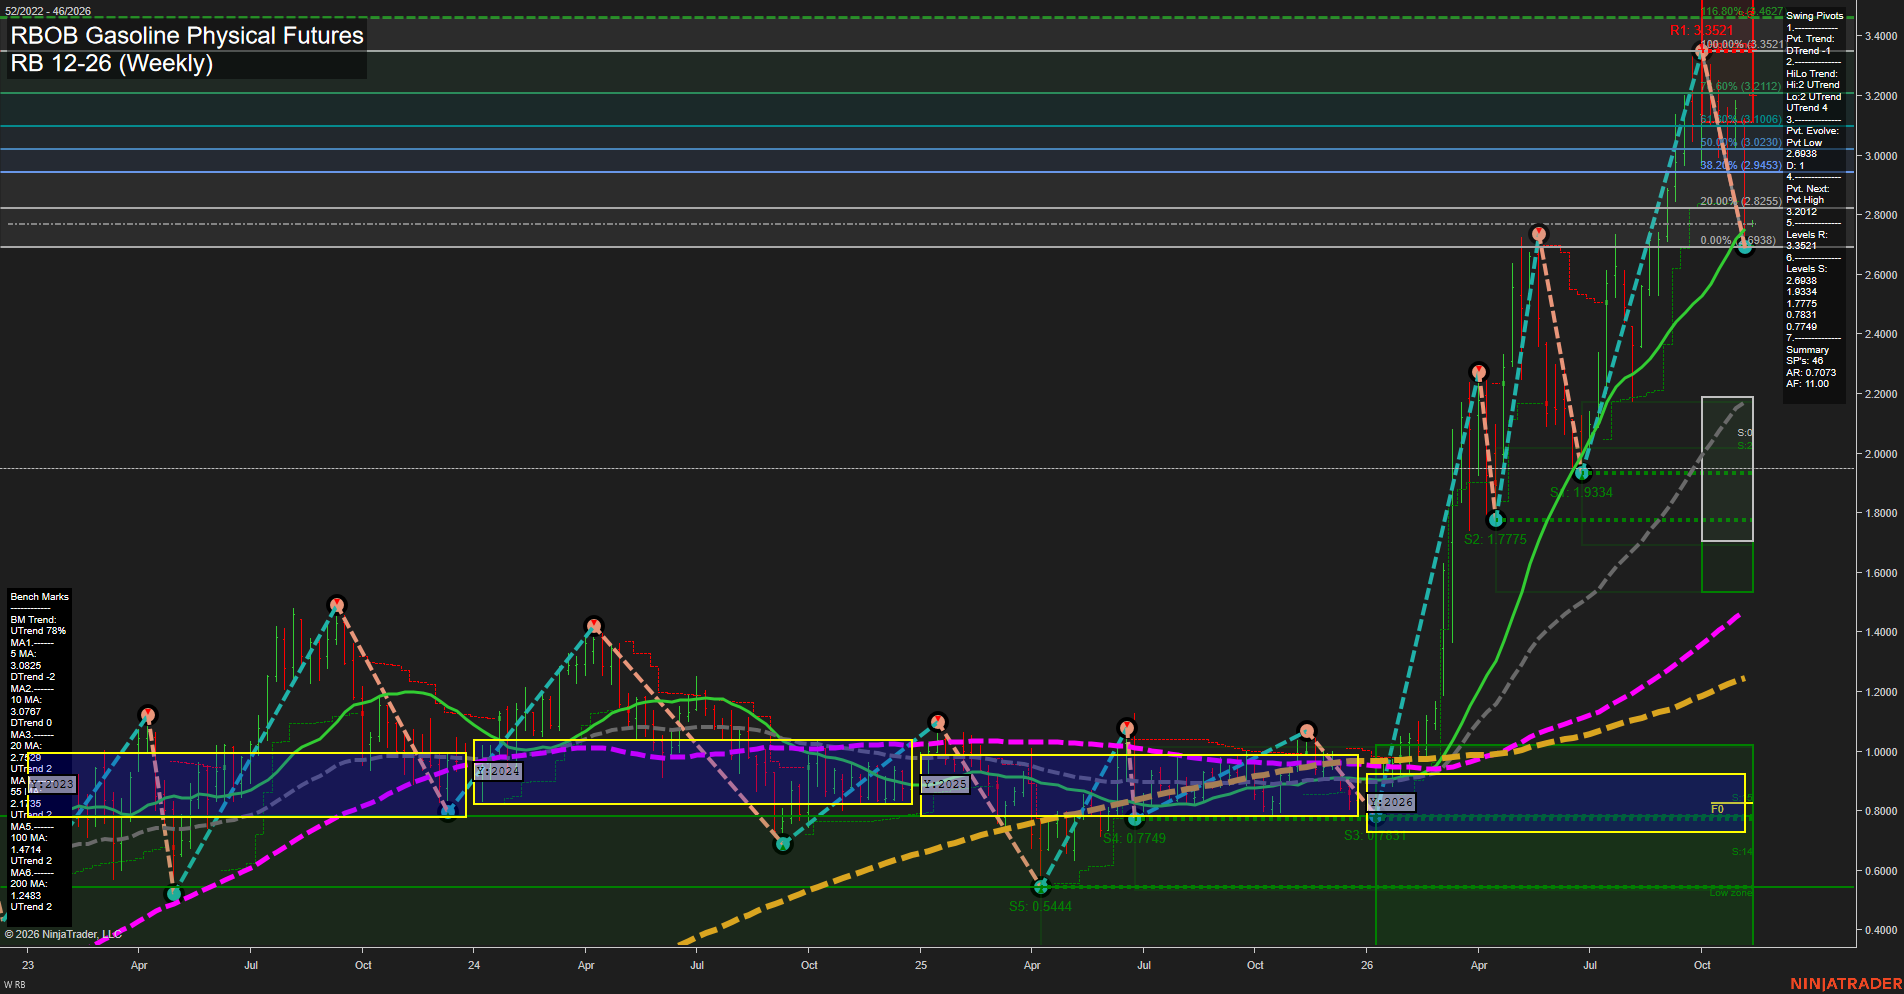
RB RBOB Gasoline Physical Futures Weekly Chart Analysis: 2026-Nov-08 18:07 CT
Price Action
- Last: 2.6938,
- Bars: Large,
- Mom: Fast.
WSFG Weekly
- Short-Term
- WSFG Current: -209%
- F0%/NTZ' Bias: Price Below,
- WSFG Trend: Down.
MSFG Month Nov
- Intermediate-Term
- MSFG Current: -64%
- F0%/NTZ' Bias: Price Below,
- MSFG Trend: Down.
YSFG Year 2026
- Long-Term
- YSFG Current: 201%
- F0%/NTZ' Bias: Price Above,
- YSFG Trend: Up.
Swing Pivots
- (Short-Term) 1. Pvt. Trend: DTrend,
- (Intermediate-Term) 2. HiLo Trend: UTrend,
- 3. Pvt. Evolve: Pvt low 2.6938,
- 4. Pvt. Next: Pvt high 3.2012,
- 5. Levels R: 3.3521, 3.2012,
- 6. Levels S: 2.6938, 1.9334, 1.7775, 0.7749.
Weekly Benchmarks
- (Short-Term) 5 Day: 3.0821 Down Trend,
- (Short-Term) 10 Day: 3.0787 Down Trend,
- (Intermediate-Term) 20 Day: 2.7529 Up Trend,
- (Intermediate-Term) 55 Day: 2.1185 Up Trend,
- (Long-Term) 100 Day: 1.4714 Up Trend,
- (Long-Term) 200 Day: 1.2483 Up Trend.
Recent Trade Signals
- 02 Nov 2026: Short RB 12-26 @ 3.0491 Signals.USAR-MSFG
- 02 Nov 2026: Short RB 12-26 @ 3.0925 Signals.USAR-WSFG
Overall Rating
- Short-Term: Bearish,
- Intermediate-Term: Neutral,
- Long-Term: Bullish.
Key Insights Summary
Price is undergoing a fast, high-volatility pullback from the 3.3521 swing high, with the latest weekly close at 2.6938 beneath both short-term benchmarks and below the weekly and monthly F0%/NTZ areas. The short-term pivot sequence has turned down, while the larger HiLo structure remains upward and price remains well above rising 55-, 100-, and 200-week benchmarks. This creates a counter-trend retracement within a still-constructive yearly advance. The 2.6938 pivot low is the immediate structural reference, while 3.2012 and 3.3521 define overhead swing resistance. The sharp 2026 rally, subsequent rejection near the upper extension, and large weekly bars indicate an active repricing phase rather than a low-volatility consolidation.
Chart Analysis ATS AI Generated: 2026-11-08 18:07 for Informational use only, not trading advice. Terms and Risk Disclosure Copyright © 2026. Algo Trading Systems LLC.