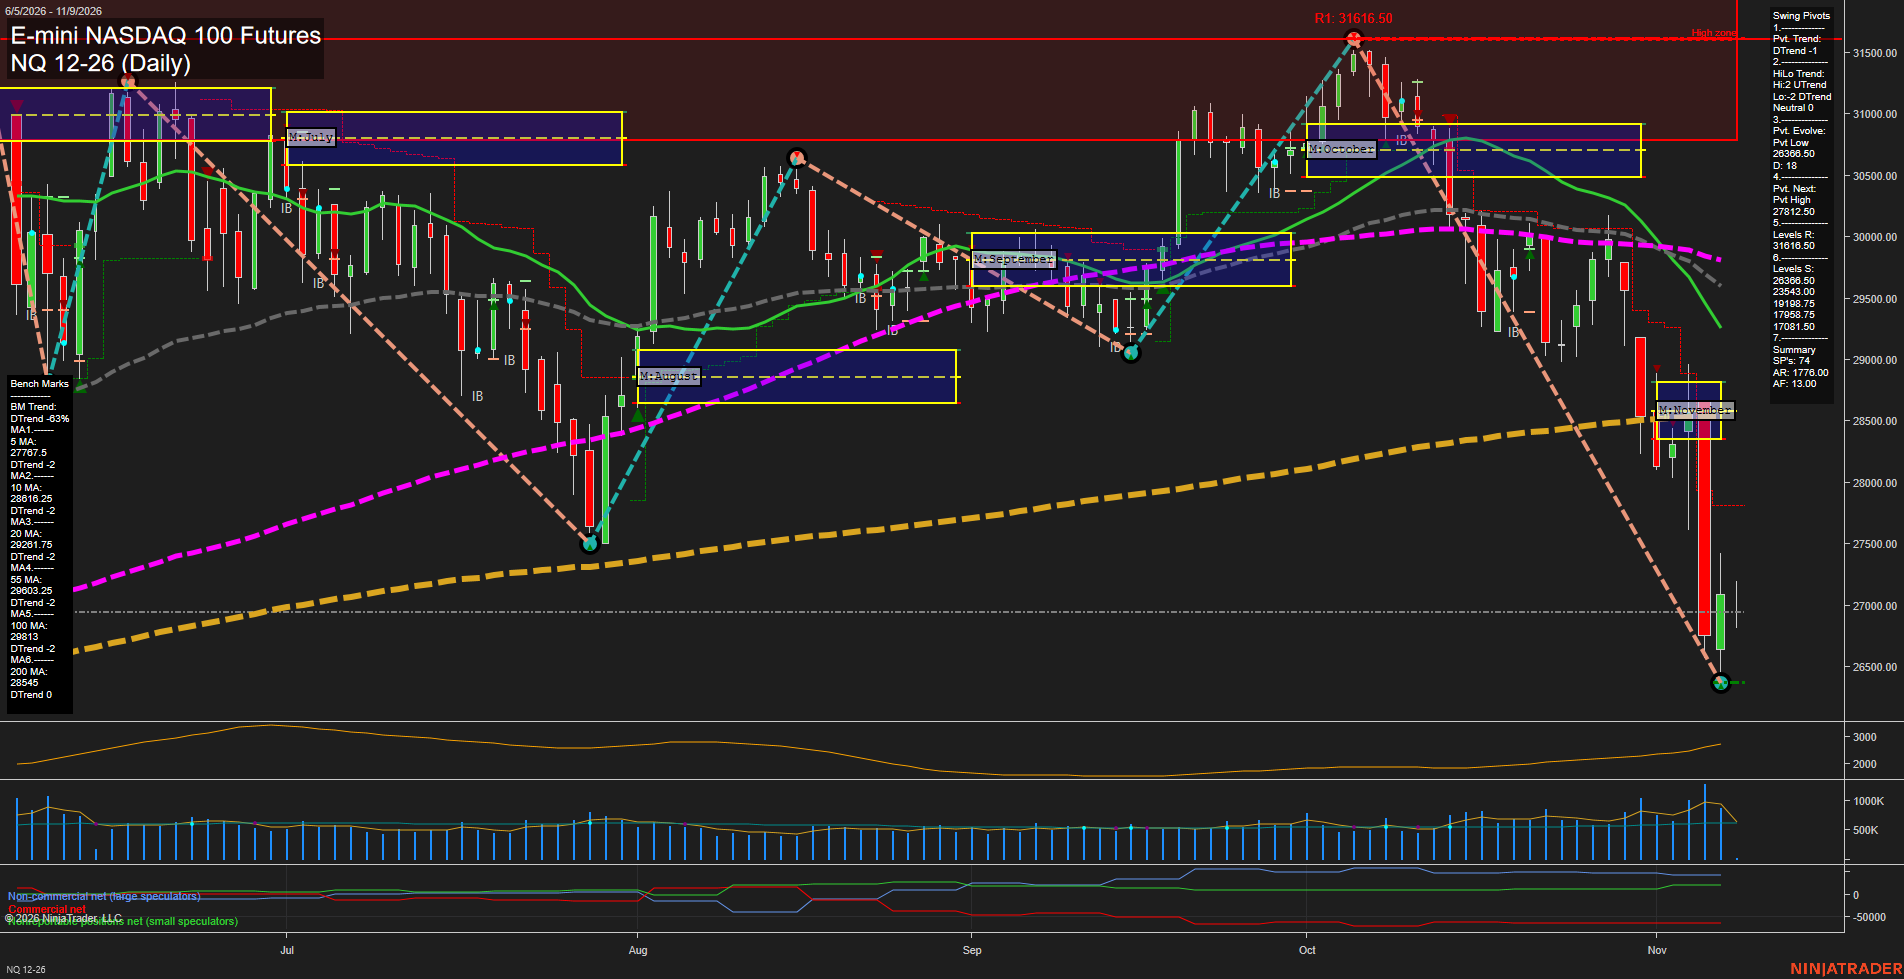
NQ E-mini NASDAQ 100 Futures Daily Chart Analysis: 2026-Nov-08 18:06 CT
Price Action
- Last: 26900,
- Bars: Large,
- Mom: fast.
WSFG Weekly
- Short-Term
- WSFG Current: 5%
- F0%/NTZ' Bias: Price Above,
- WSFG Trend: Up.
MSFG Month Nov
- Intermediate-Term
- MSFG Current: -63%
- F0%/NTZ' Bias: Price Below,
- MSFG Trend: Down.
YSFG Year 2026
- Long-Term
- YSFG Current: 7%
- F0%/NTZ' Bias: Price Above,
- YSFG Trend: Up.
Swing Pivots
- (Short-Term) 1. Pvt. Trend: DTrend,
- (Intermediate-Term) 2. HiLo Trend: UTrend,
- 3. Pvt. Evolve: Pvt low 26368.50,
- 4. Pvt. Next: Pvt high 27812.50,
- 5. Levels R: 31616.50,
- 6. Levels S: 26368.50, 23543.00, 19198.75, 17958.75, 17081.50.
Daily Benchmarks
- (Short-Term) 5 Day: 27767.50 Down Trend,
- (Short-Term) 10 Day: 28616.25 Down Trend,
- (Intermediate-Term) 20 Day: 29281.75 Down Trend,
- (Intermediate-Term) 55 Day: 29603.25 Down Trend,
- (Long-Term) 100 Day: 29813.00 Down Trend,
- (Long-Term) 200 Day: 28545.00 Up Trend.
Additional Metrics
- ATR: 1618,
- VOLMA: 626746.
Recent Trade Signals
- 05 Nov 2026: Short NQ 12-26 @ 28327 Signals.USAR-WSFG
- 03 Nov 2026: Short NQ 12-26 @ 28103.25 Signals.USAR-MSFG
Overall Rating
- Short-Term: Bearish,
- Intermediate-Term: Bearish,
- Long-Term: Neutral.
Key Insights Summary
The daily structure reflects a high-momentum selloff from the October peak near 31616.50, with price decisively below every short- and intermediate-term benchmark. The short-term pivot trend and November MSFG remain bearish, while the sharp decline has established 26368.50 as the active swing-low reference. The intermediate HiLo structure remains technically upward, but it is under pressure after the reversal through the 20-, 55-, and 100-day averages. The 200-day average near 28545.00 remains an important longer-cycle reference, with price now below it. Expanded ATR and elevated recent volume characterize a volatile liquidation phase rather than an orderly pullback; the current rebound candles remain small relative to the preceding breakdown bars.
Chart Analysis ATS AI Generated: 2026-11-08 18:06 for Informational use only, not trading advice. Terms and Risk Disclosure Copyright © 2026. Algo Trading Systems LLC.