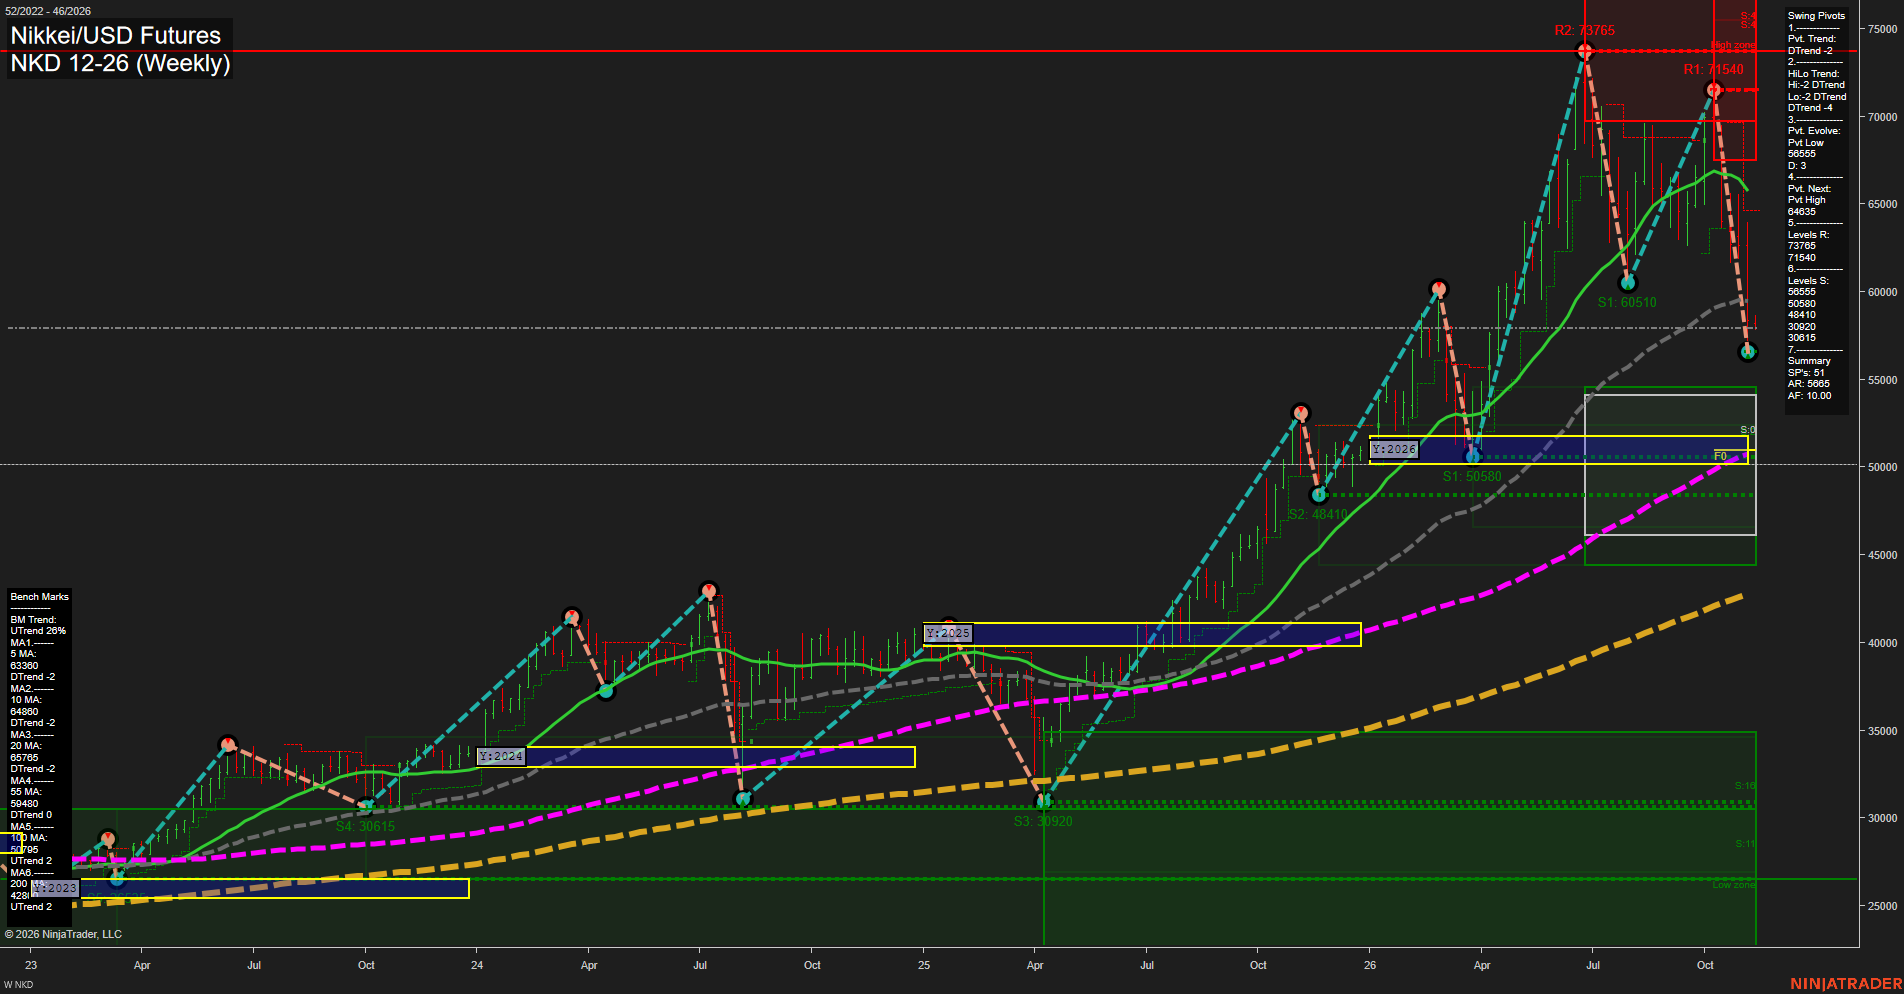
NKD Nikkei/USD Futures Weekly Chart Analysis: 2026-Nov-08 18:06 CT
Price Action
- Last: 58410,
- Bars: Large,
- Mom: Momentum fast.
WSFG Weekly
- Short-Term
- WSFG Current: 5%
- F0%/NTZ' Bias: Price Above,
- WSFG Trend: Up.
MSFG Month Nov
- Intermediate-Term
- MSFG Current: -56%
- F0%/NTZ' Bias: Price Below,
- MSFG Trend: Down.
YSFG Year 2026
- Long-Term
- YSFG Current: 88%
- F0%/NTZ' Bias: Price Above,
- YSFG Trend: Up.
Swing Pivots
- (Short-Term) 1. Pvt. Trend: DTrend,
- (Intermediate-Term) 2. HiLo Trend: DTrend,
- 3. Pvt. Evolve: Pvt low 56555,
- 4. Pvt. Next: Pvt high 60435,
- 5. Levels R: 73765, 71540,
- 6. Levels S: 56555, 50580, 48410, 30920, 30815.
Weekly Benchmarks
- (Short-Term) 5 Day: 63396 Down Trend,
- (Short-Term) 10 Day: 64800 Down Trend,
- (Intermediate-Term) 20 Day: 65765 Down Trend,
- (Intermediate-Term) 55 Day: 59480 Down Trend,
- (Long-Term) 100 Day: 50795 Up Trend,
- (Long-Term) 200 Day: 42818 Up Trend.
Recent Trade Signals
- 04 Nov 2026: Long NKD 12-26 @ 63190 Signals.USAR-WSFG
- 04 Nov 2026: Long NKD 12-26 @ 63505 Signals.USAR-MSFG
Overall Rating
- Short-Term: Bearish,
- Intermediate-Term: Bearish,
- Long-Term: Bullish.
Key Insights Summary
NKD has shifted into a fast, high-volatility weekly downswing from the 71540 pivot high, producing a lower-high and lower-low sequence and moving beneath the 5, 10, 20, and 55-period benchmarks. The 56555 pivot low is the immediate structural support, while 60435 defines the next pivot-reversal threshold and 59480-65765 represents a dense overhead benchmark zone. The weekly fib structure remains positive above F0%, but the November monthly grid and pivot structure reflect a counter-trend retracement within the still-positive yearly trend. Long-term trend alignment remains constructive above the rising 100 and 200-period averages, while short- and intermediate-term price behavior is dominated by the sharp selloff and momentum reset.
Chart Analysis ATS AI Generated: 2026-11-08 18:06 for Informational use only, not trading advice. Terms and Risk Disclosure Copyright © 2026. Algo Trading Systems LLC.