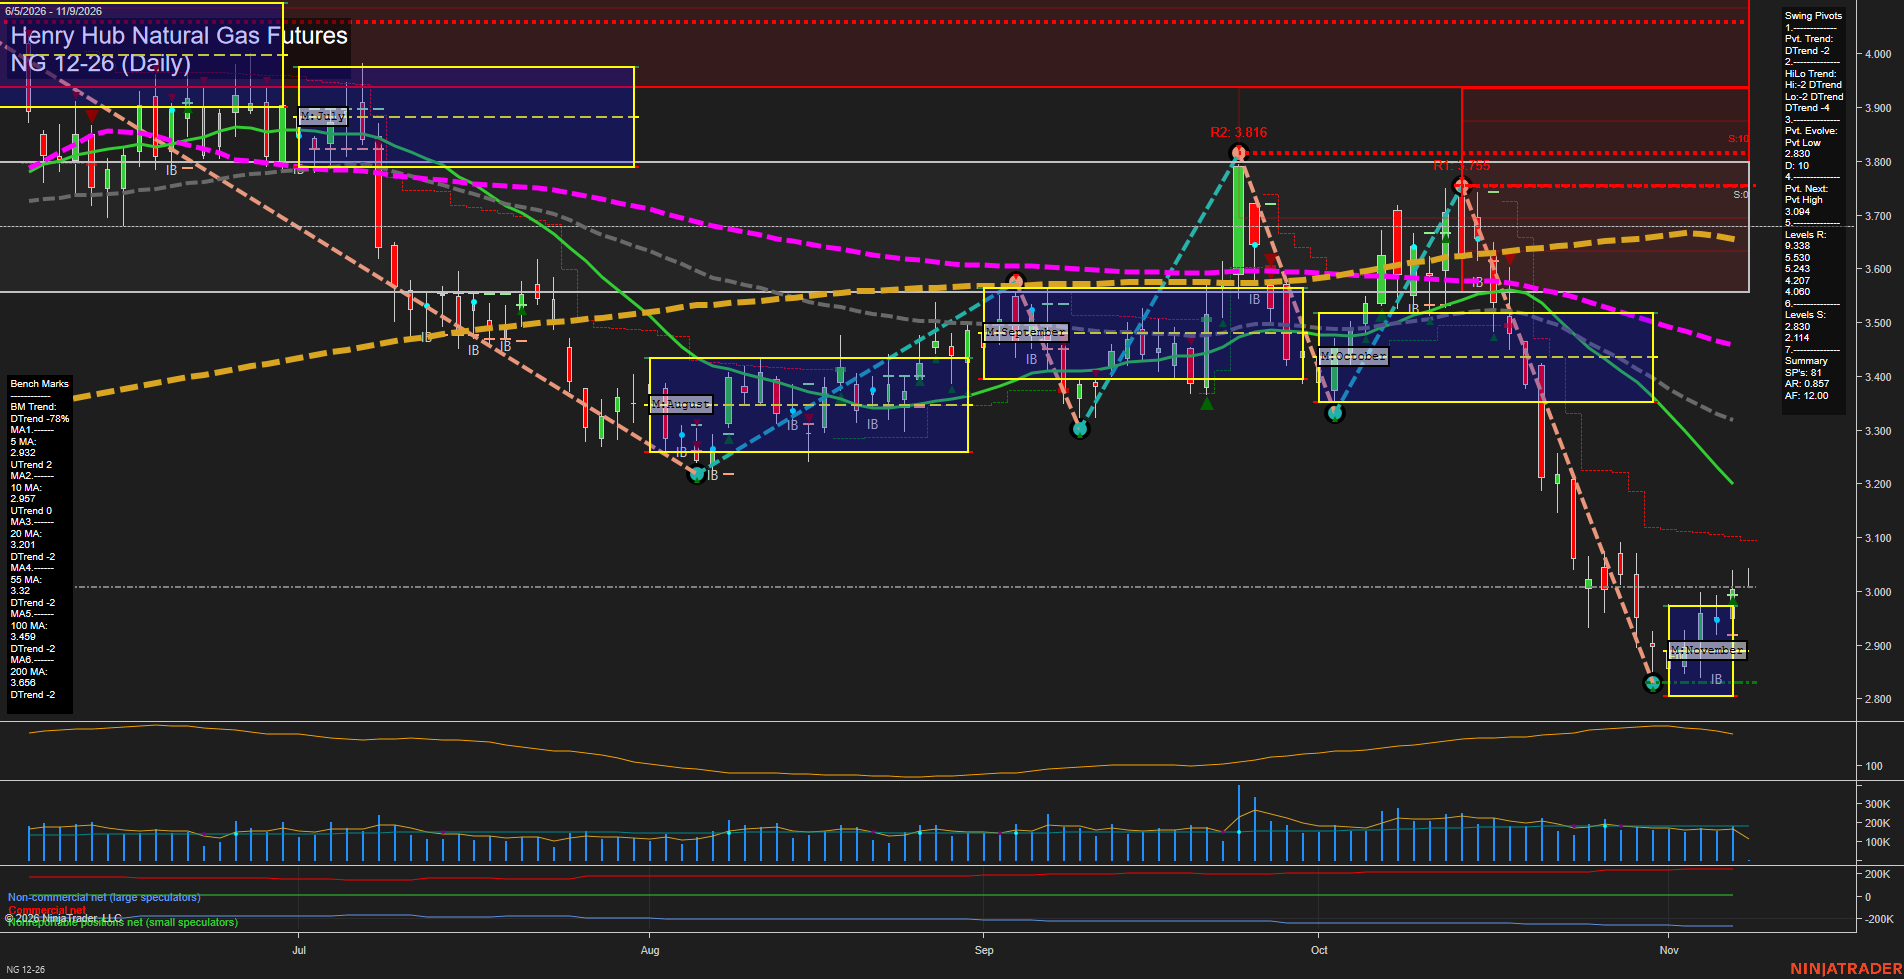
NG Henry Hub Natural Gas Futures Daily Chart Analysis: 2026-Nov-08 18:05 CT
Price Action
- Last: 2.997,
- Bars: Small,
- Mom: Slow.
WSFG Weekly
- Short-Term
- WSFG Current: -78%
- F0%/NTZ' Bias: Price Below,
- WSFG Trend: Down.
MSFG Month Nov
- Intermediate-Term
- MSFG Current: -32%
- F0%/NTZ' Bias: Price Below,
- MSFG Trend: Down.
YSFG Year 2026
- Long-Term
- YSFG Current: 8%
- F0%/NTZ' Bias: Price Above,
- YSFG Trend: Up.
Swing Pivots
- (Short-Term) 1. Pvt. Trend: DTrend,
- (Intermediate-Term) 2. HiLo Trend: DTrend,
- 3. Pvt. Evolve: Pvt low 2.830,
- 4. Pvt. Next: Pvt high 3.094,
- 5. Levels R: 9.338, 5.530, 5.243, 4.207, 4.060,
- 6. Levels S: 2.830, 2.114.
Daily Benchmarks
- (Short-Term) 5 Day: 2.932 Down Trend,
- (Short-Term) 10 Day: 2.957 Down Trend,
- (Intermediate-Term) 20 Day: 3.200 Down Trend,
- (Intermediate-Term) 55 Day: 3.320 Down Trend,
- (Long-Term) 100 Day: 3.459 Down Trend,
- (Long-Term) 200 Day: 3.656 Down Trend.
Additional Metrics
Recent Trade Signals
- 06 Nov 2026: Long NG 12-26 @ 2.997 Signals.USAR-MSFG
- 05 Nov 2026: Long NG 12-26 @ 2.95 Signals.USAR-WSFG
Overall Rating
- Short-Term: Bearish,
- Intermediate-Term: Bearish,
- Long-Term: Bearish.
Key Insights Summary
NG has stabilized near the 2.830 pivot-low support following a steep October selloff, producing a small-bar rebound toward 3.00. The bounce remains counter-trend in the daily structure: both pivot measures are in DTrend, price is below the weekly and monthly Fib-grid centers, and all benchmark averages remain in declining alignment above price. The 3.094 next-pivot threshold defines the nearby structural recovery level, while 2.830 remains the immediate downside reference. Seasonally elevated winter demand sensitivity may sustain volatility, but current price action reflects a compressed basing attempt within a broader lower-high, lower-low decline.
Chart Analysis ATS AI Generated: 2026-11-08 18:06 for Informational use only, not trading advice. Terms and Risk Disclosure Copyright © 2026. Algo Trading Systems LLC.