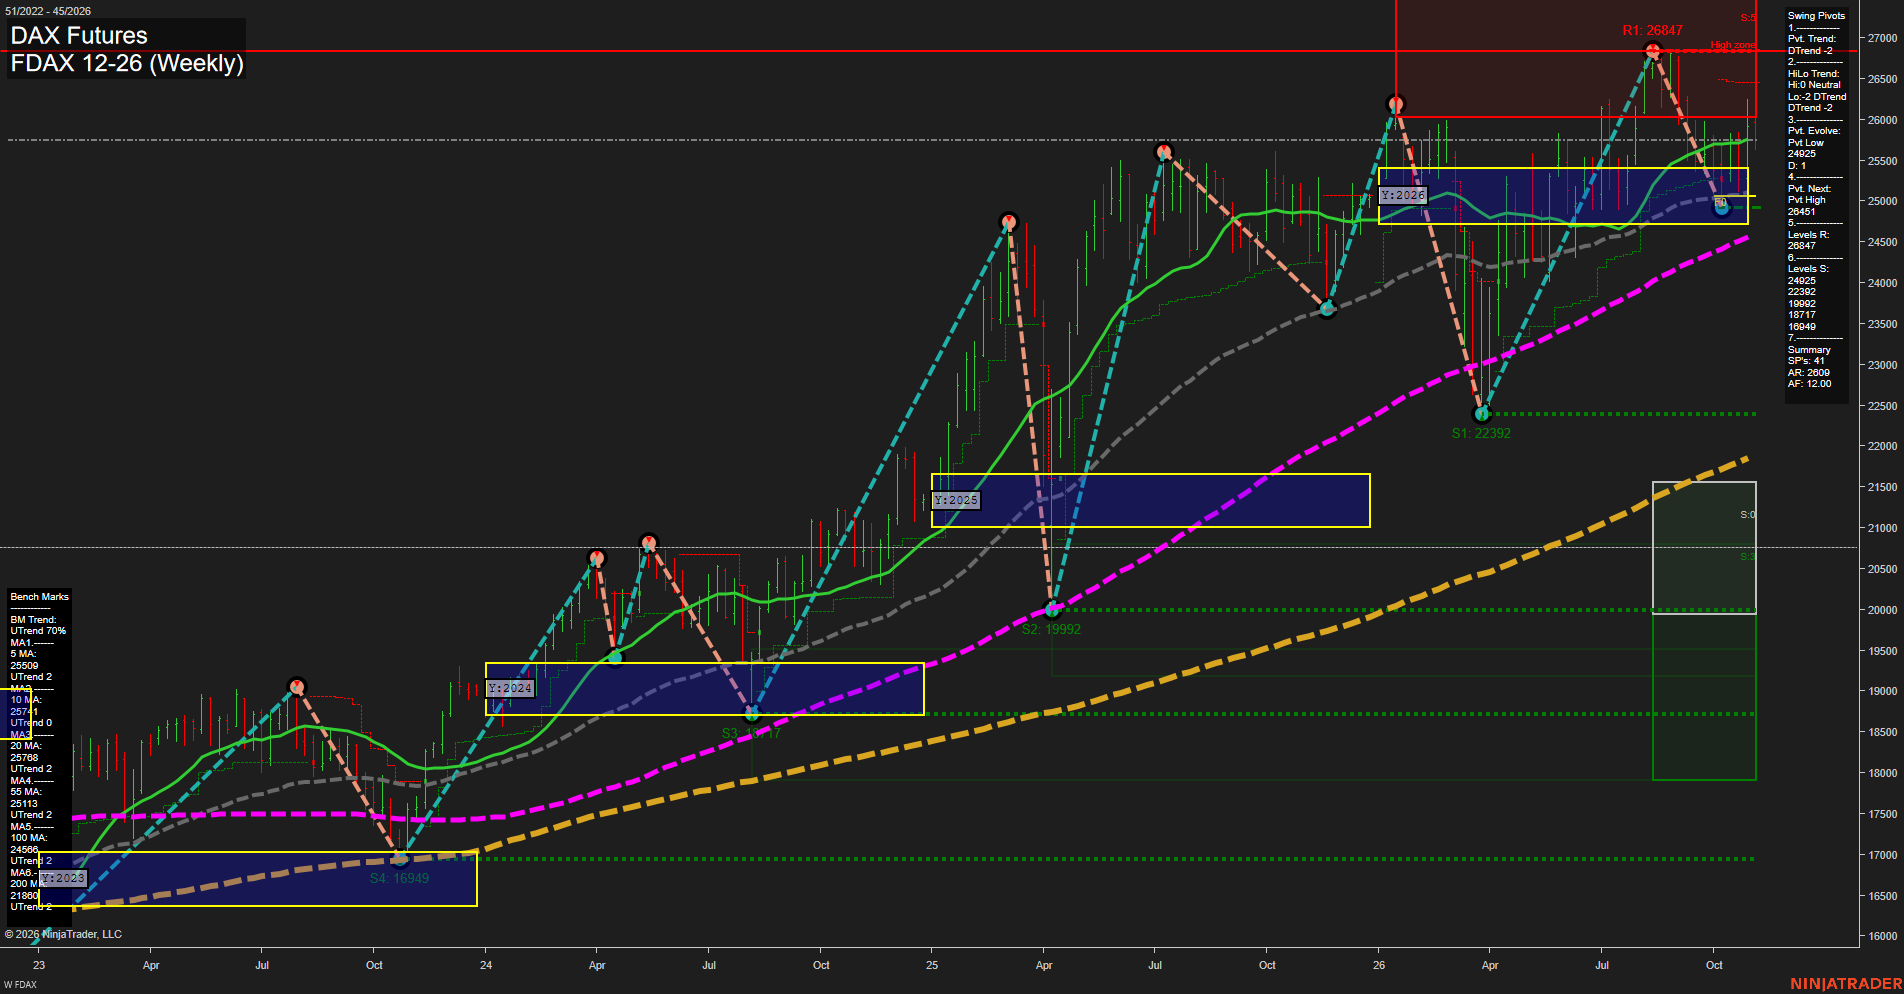
FDAX DAX Futures Weekly Chart Analysis: 2026-Nov-08 18:04 CT
Price Action
- Last: 24925,
- Bars: Small,
- Mom: Fast.
WSFG Weekly
- Short-Term
- WSFG Current: -29%
- F0%/NTZ' Bias: Price Below,
- WSFG Trend: Down.
MSFG Month Nov
- Intermediate-Term
- MSFG Current: -18%
- F0%/NTZ' Bias: Price Below,
- MSFG Trend: Down.
YSFG Year 2026
- Long-Term
- YSFG Current: 20%
- F0%/NTZ' Bias: Price Above,
- YSFG Trend: Up.
Swing Pivots
- (Short-Term) 1. Pvt. Trend: DTrend,
- (Intermediate-Term) 2. HiLo Trend: UTrend,
- 3. Pvt. Evolve: Pvt low 24925,
- 4. Pvt. Next: Pvt high 26451,
- 5. Levels R: 26847,
- 6. Levels S: 24925, 22392, 19992, 18717, 16849.
Weekly Benchmarks
- (Short-Term) 5 Day: 25598 Up Trend,
- (Short-Term) 10 Day: 25741 Up Trend,
- (Intermediate-Term) 20 Day: 25768 Up Trend,
- (Intermediate-Term) 55 Day: 25113 Up Trend,
- (Long-Term) 100 Day: 24568 Up Trend,
- (Long-Term) 200 Day: 21809 Up Trend.
Recent Trade Signals
- 06 Nov 2026: Short FDAX 12-26 @ 25803 Signals.USAR-MSFG
- 06 Nov 2026: Short FDAX 12-26 @ 25803 Signals.USAR-WSFG
Overall Rating
- Short-Term: Bearish,
- Intermediate-Term: Neutral,
- Long-Term: Bullish.
Key Insights Summary
Price has transitioned into a sharp weekly pullback from the 26847 swing high and is trading beneath the weekly and monthly Fib-grid centers. The short-term pivot structure is down, with 24925 defining the active pivot-low support and 26451 marking the reversal threshold for a new pivot high. The larger structure remains constructive: higher-order moving averages retain upward slopes, price remains above the 100- and 200-week benchmarks, and the yearly Fib-grid bias is positive. This creates a bearish short-term retracement within a broader bullish long-term trend, with 24925 as the immediate structural test and 26847 as the major overhead swing resistance.
Chart Analysis ATS AI Generated: 2026-11-08 18:04 for Informational use only, not trading advice. Terms and Risk Disclosure Copyright © 2026. Algo Trading Systems LLC.