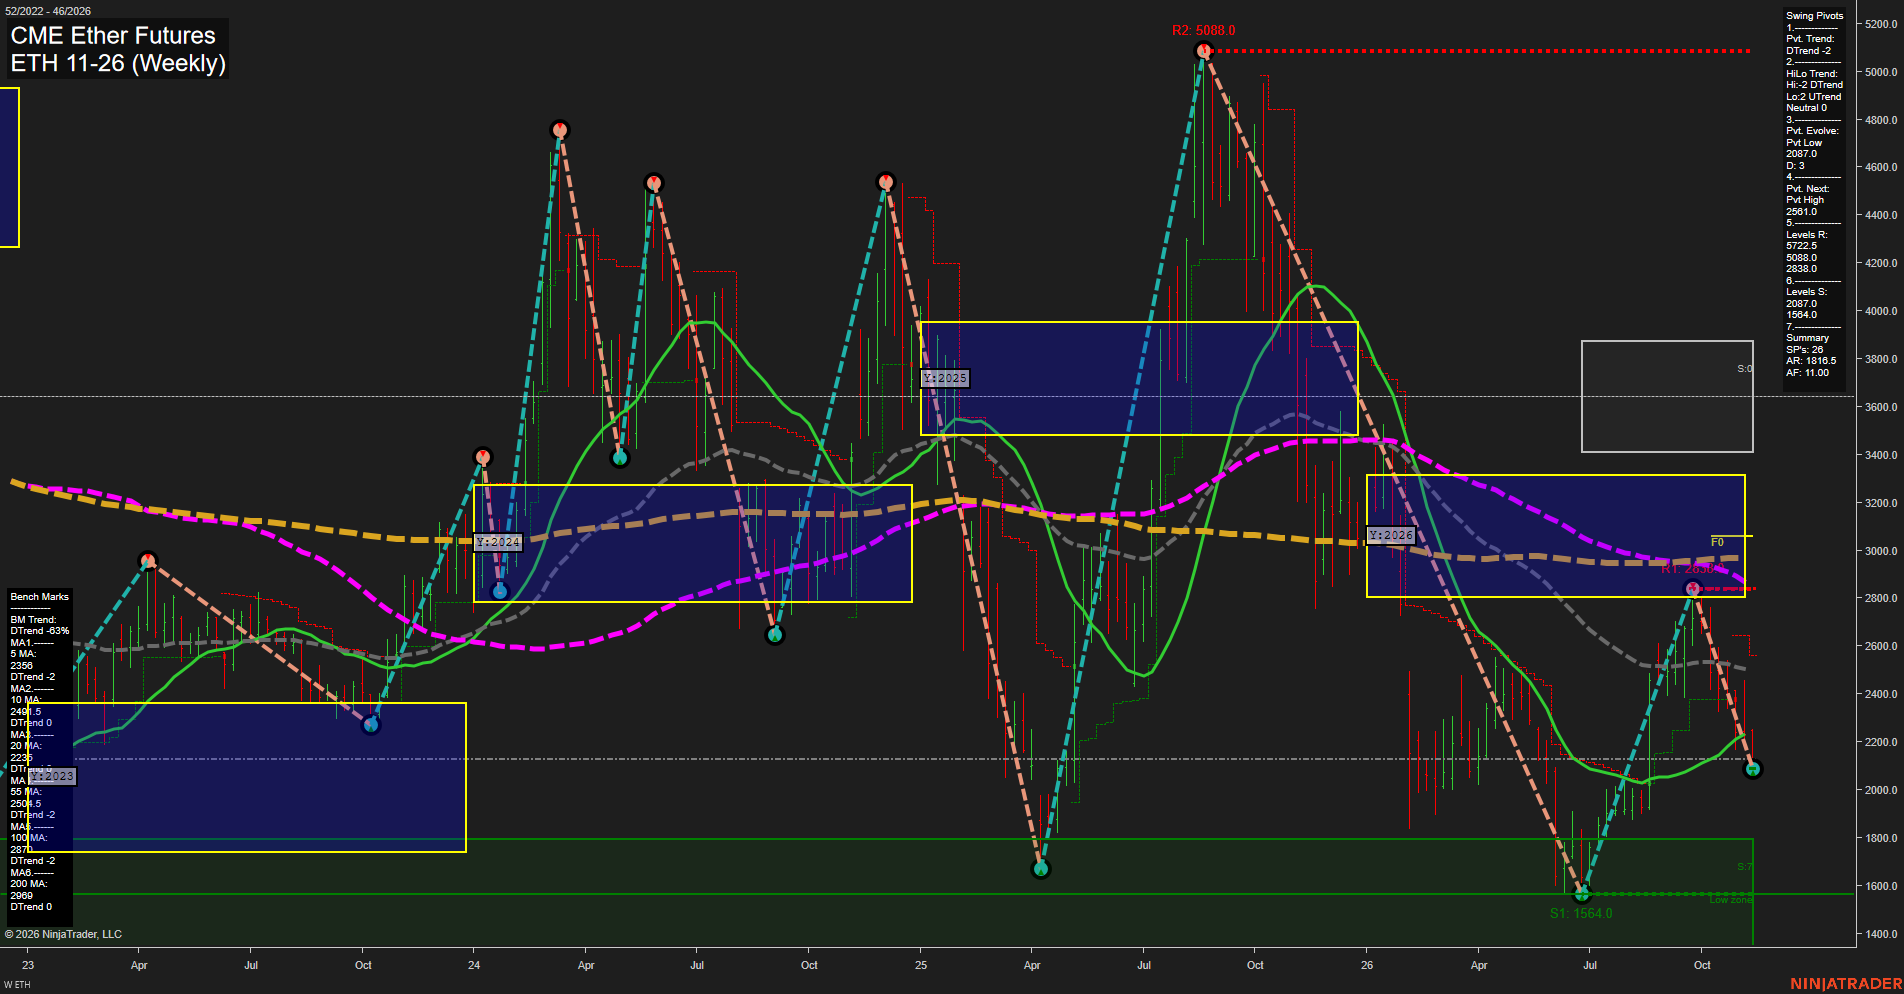
ETH CME Ether Futures Weekly Chart Analysis: 2026-Nov-08 18:03 CT
Price Action
- Last: 2140.0,
- Bars: Medium,
- Mom: fast.
WSFG Weekly
- Short-Term
- WSFG Current: -59%
- F0%/NTZ' Bias: Price Below,
- WSFG Trend: Down.
MSFG Month Nov
- Intermediate-Term
- MSFG Current: -22%
- F0%/NTZ' Bias: Price Below,
- MSFG Trend: Down.
YSFG Year 2026
- Long-Term
- YSFG Current: -36%
- F0%/NTZ' Bias: Price Below,
- YSFG Trend: Down.
Swing Pivots
- (Short-Term) 1. Pvt. Trend: DTrend,
- (Intermediate-Term) 2. HiLo Trend: DTrend,
- 3. Pvt. Evolve: Pvt low 2087.0,
- 4. Pvt. Next: Pvt high 2561.0,
- 5. Levels R: 5088.0, 2838.0,
- 6. Levels S: 2087.0, 1564.0.
Weekly Benchmarks
- (Short-Term) 5 Day: 2358.5 Down Trend,
- (Short-Term) 10 Day: 2491.5 Down Trend,
- (Intermediate-Term) 20 Day: 2235.5 Down Trend,
- (Intermediate-Term) 55 Day: 2504.5 Down Trend,
- (Long-Term) 100 Day: 2870.0 Down Trend,
- (Long-Term) 200 Day: 2808.0 Down Trend.
Recent Trade Signals
- 06 Nov 2026: Short ETH 11-26 @ 2230 Signals.USAR-WSFG
- 04 Nov 2026: Long ETH 11-26 @ 2333 Signals.USAR-MSFG
Overall Rating
- Short-Term: Bearish,
- Intermediate-Term: Bearish,
- Long-Term: Bearish.
Key Insights Summary
ETH futures remain in a broad bearish swing structure, with price below every weekly benchmark and beneath the weekly, monthly, and yearly Fib-grid centers. The recent rejection from 2838.0 established a lower high and accelerated into the 2087.0 pivot-low area, leaving momentum fast to the downside. The active pivot sequence remains a DTrend, while 2561.0 defines the next opposing pivot threshold and 2838.0 remains the nearer structural resistance. Below the market, 2087.0 is the immediate swing support and 1564.0 marks the larger downside support zone; the chart character remains volatile, corrective, and dominated by lower-high/lower-low behavior.
Chart Analysis ATS AI Generated: 2026-11-08 18:04 for Informational use only, not trading advice. Terms and Risk Disclosure Copyright © 2026. Algo Trading Systems LLC.