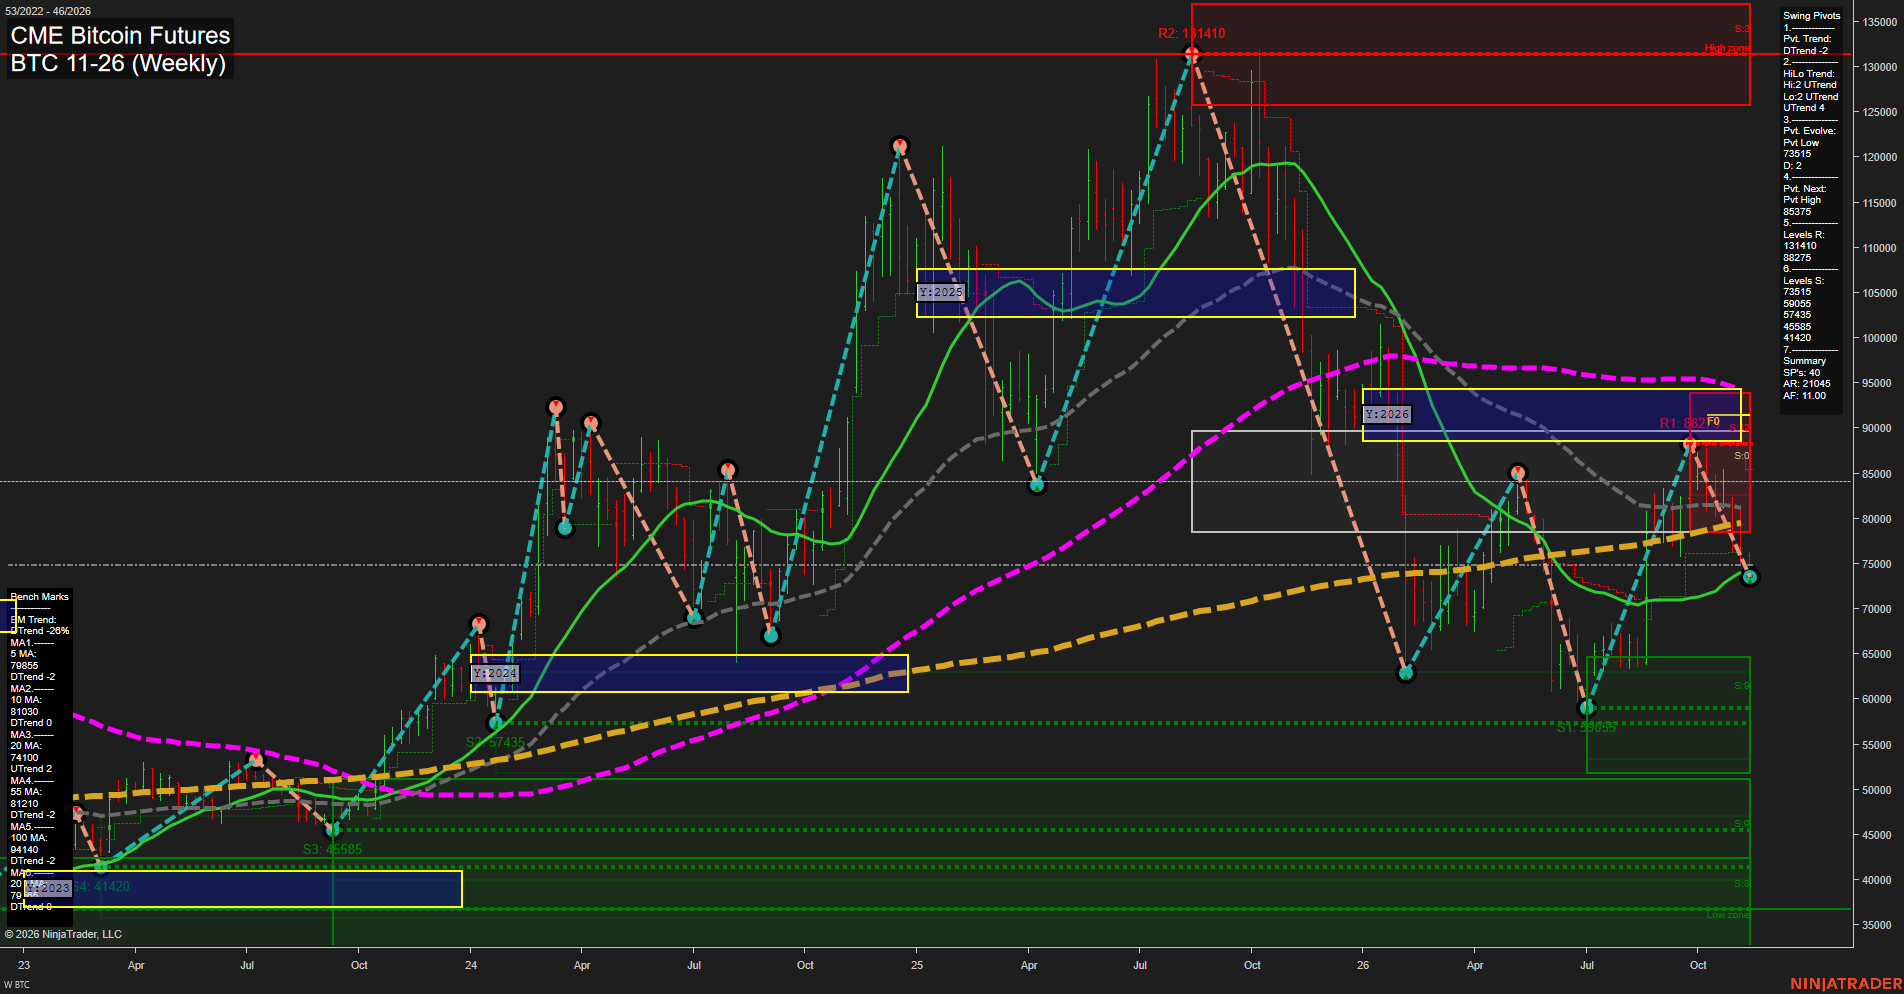
BTC CME Bitcoin Futures Weekly Chart Analysis: 2026-Nov-08 18:02 CT
Price Action
- Last: 78690,
- Bars: Medium,
- Mom: average.
WSFG Weekly
- Short-Term
- WSFG Current: -25%
- F0%/NTZ' Bias: Price Below,
- WSFG Trend: Down.
MSFG Month Nov
- Intermediate-Term
- MSFG Current: -21%
- F0%/NTZ' Bias: Price Below,
- MSFG Trend: Down.
YSFG Year 2026
- Long-Term
- YSFG Current: -58%
- F0%/NTZ' Bias: Price Below,
- YSFG Trend: Down.
Swing Pivots
- (Short-Term) 1. Pvt. Trend: DTrend,
- (Intermediate-Term) 2. HiLo Trend: UTrend,
- 3. Pvt. Evolve: Pvt low 73515,
- 4. Pvt. Next: Pvt high 85375,
- 5. Levels R: 113410, 88275,
- 6. Levels S: 75515, 59095, 57345, 45585, 41420.
Weekly Benchmarks
- (Short-Term) 5 Day: 79850 Down Trend,
- (Short-Term) 10 Day: 81030 Down Trend,
- (Intermediate-Term) 20 Day: 74100 Up Trend,
- (Intermediate-Term) 55 Day: 81210 Down Trend,
- (Long-Term) 100 Day: 94140 Down Trend,
- (Long-Term) 200 Day: 78800 Down Trend.
Recent Trade Signals
- 05 Nov 2026: Short BTC 11-26 @ 76460 Signals.USAR-MSFG
- 04 Nov 2026: Long BTC 11-26 @ 78690 Signals.USAR-WSFG
Overall Rating
- Short-Term: Bearish,
- Intermediate-Term: Bearish,
- Long-Term: Bearish.
Key Insights Summary
Price is consolidating near the 200-week benchmark after a sharp rebound from the 59095 swing-low region, but the recovery failed below the 88275 pivot resistance and has rotated back under the short-term 5, 10, and 55-period benchmarks. The active pivot structure remains a short-term DTrend, with 75515 as the nearest structural support and 85375 the reversal threshold for the next pivot high. Intermediate pivot structure remains constructive from the July low, yet monthly and yearly Fib-grid positioning remains below F0% and confirms the broader corrective bear-cycle backdrop. The chart reflects choppy, elevated-volatility trade within a larger lower-high sequence beneath the 94140 long-term benchmark.
Chart Analysis ATS AI Generated: 2026-11-08 18:02 for Informational use only, not trading advice. Terms and Risk Disclosure Copyright © 2026. Algo Trading Systems LLC.