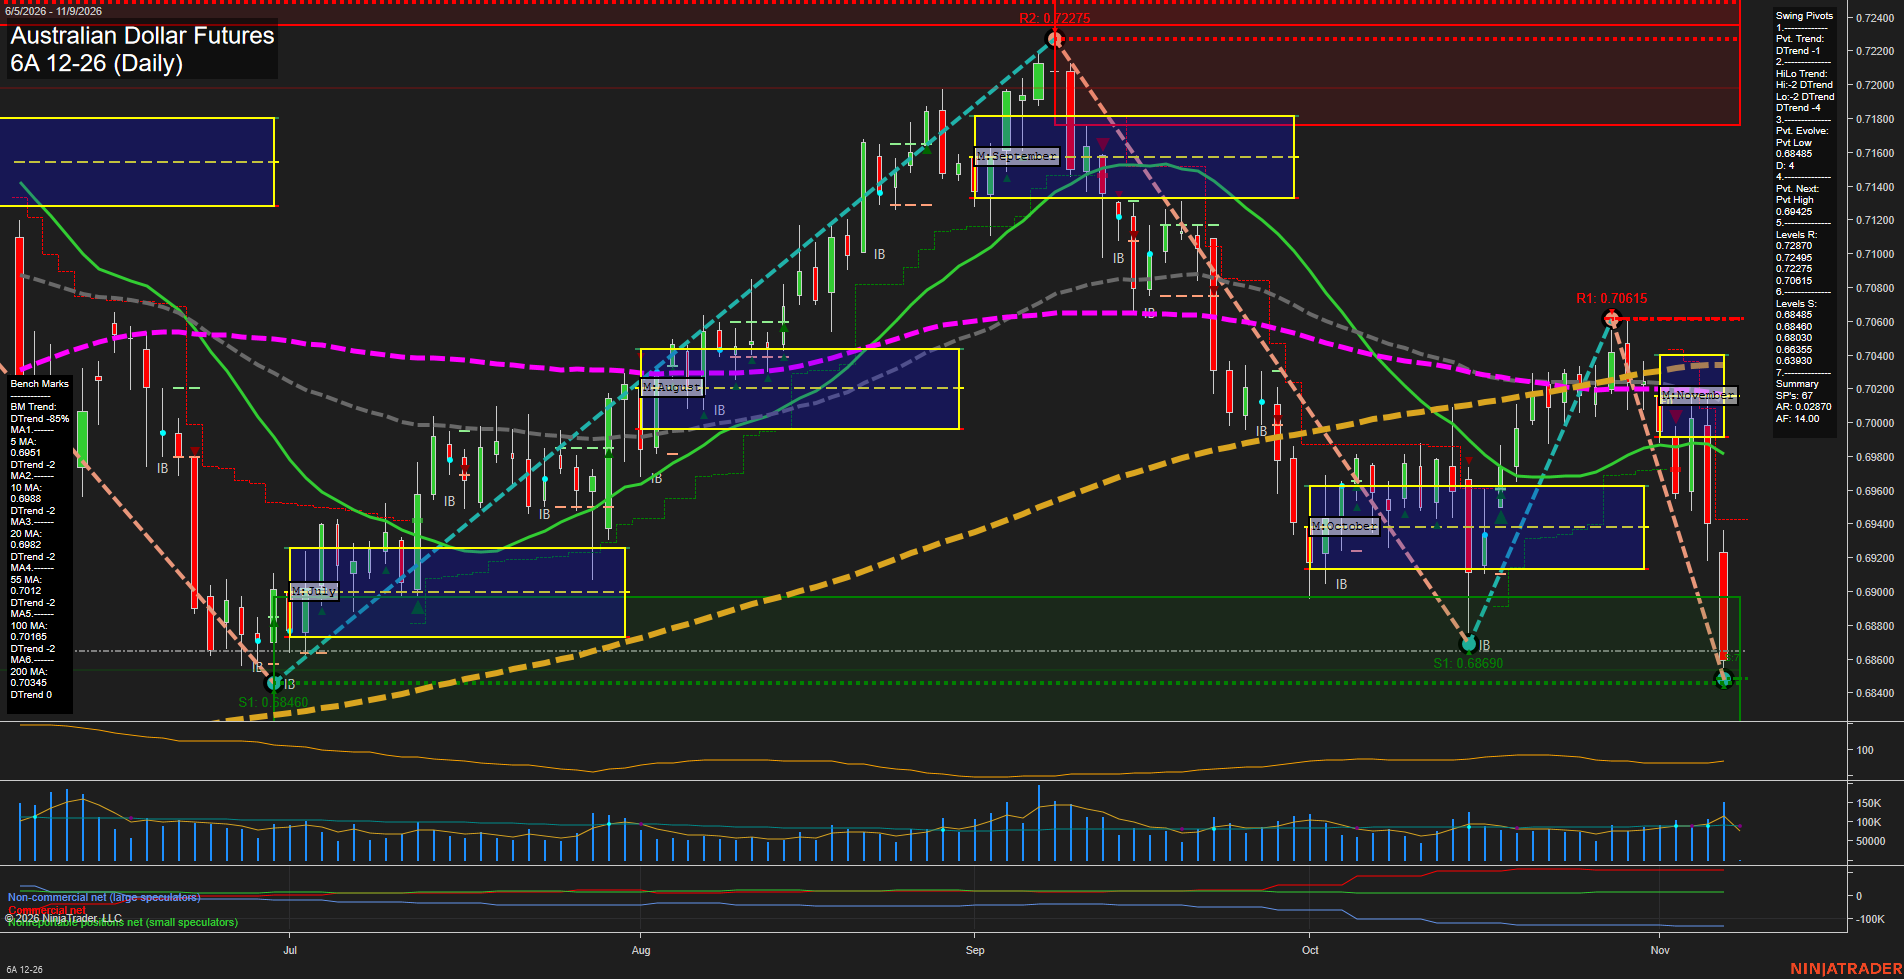
6A Australian Dollar Futures Daily Chart Analysis: 2026-Nov-08 18:00 CT
Price Action
- Last: 0.69300,
- Bars: Medium,
- Mom: Fast.
WSFG Weekly
- Short-Term
- WSFG Current: 57%
- F0%/NTZ' Bias: Price Above,
- WSFG Trend: Up.
MSFG Month Nov
- Intermediate-Term
- MSFG Current: 35%
- F0%/NTZ' Bias: Price Above,
- MSFG Trend: Up.
YSFG Year 2026
- Long-Term
- YSFG Current: 32%
- F0%/NTZ' Bias: Price Above,
- YSFG Trend: Up.
Swing Pivots
- (Short-Term) 1. Pvt. Trend: DTrend,
- (Intermediate-Term) 2. HiLo Trend: DTrend,
- 3. Pvt. Evolve: Pvt low 0.68485,
- 4. Pvt. Next: Pvt high 0.69425,
- 5. Levels R: 0.72870, 0.72495, 0.72275, 0.71400,
- 6. Levels S: 0.68485, 0.68460, 0.68355, 0.68300.
Daily Benchmarks
- (Short-Term) 5 Day: 0.69910 Down Trend,
- (Short-Term) 10 Day: 0.69880 Down Trend,
- (Intermediate-Term) 20 Day: 0.69820 Down Trend,
- (Intermediate-Term) 55 Day: 0.70120 Down Trend,
- (Long-Term) 100 Day: 0.70160 Down Trend,
- (Long-Term) 200 Day: 0.70345 Down Trend.
Additional Metrics
Recent Trade Signals
- 02 Nov 2026: Short 6A 12-26 @ 0.699 Signals.USAR-MSFG
- 02 Nov 2026: Short 6A 12-26 @ 0.70035 Signals.USAR-WSFG
Overall Rating
- Short-Term: Bearish,
- Intermediate-Term: Bearish,
- Long-Term: Bearish.
Key Insights Summary
Price has reversed sharply from the September high near 0.7230 and remains below every daily benchmark, confirming broad downside alignment across short-, intermediate-, and long-term measures. The recent rebound toward 0.7060 failed beneath declining moving-average resistance and produced a renewed selloff, maintaining a lower-high structure. Current action is approaching the 0.69425 pivot threshold, while the 0.68485 to 0.68300 support cluster remains the major downside reference area. Weekly, monthly, and yearly Fib-grid positioning remains above their F0% levels, indicating the broader session grids have not fully broken down despite the bearish daily swing structure.
Chart Analysis ATS AI Generated: 2026-11-08 18:00 for Informational use only, not trading advice. Terms and Risk Disclosure Copyright © 2026. Algo Trading Systems LLC.