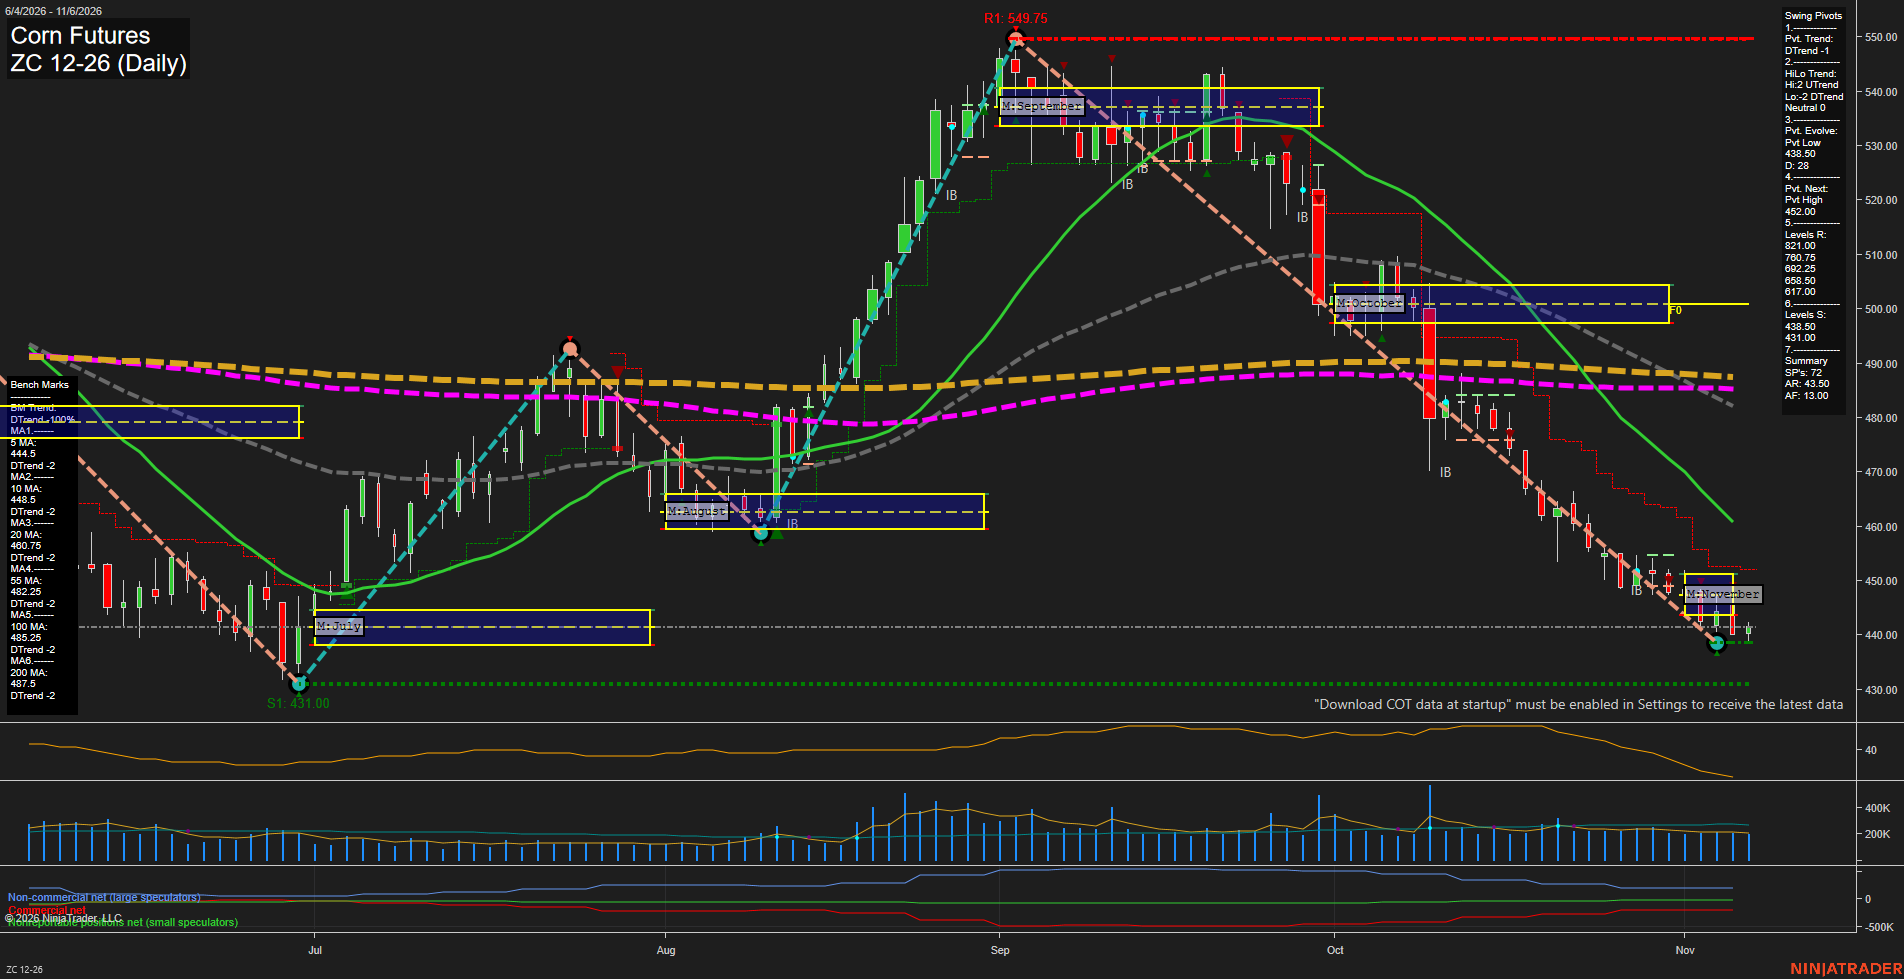
ZC Corn Futures Daily Chart Analysis: 2026-Nov-07 07:10 CT
Price Action
- Last: 440.25,
- Bars: Medium,
- Mom: fast.
WSFG Weekly
- Short-Term
- WSFG Current: -25%
- F0%/NTZ' Bias: Price Below,
- WSFG Trend: Down.
MSFG Month Nov
- Intermediate-Term
- MSFG Current: -9%
- F0%/NTZ' Bias: Price Below,
- MSFG Trend: Down.
YSFG Year 2026
- Long-Term
- YSFG Current: -41%
- F0%/NTZ' Bias: Price Below,
- YSFG Trend: Down.
Swing Pivots
- (Short-Term) 1. Pvt. Trend: DTrend,
- (Intermediate-Term) 2. HiLo Trend: UTrend,
- 3. Pvt. Evolve: Pvt low 438.50,
- 4. Pvt. Next: Pvt high 452.00,
- 5. Levels R: 538.50, 700.75, 692.25, 658.50, 617.00,
- 6. Levels S: 438.50, 431.00.
Daily Benchmarks
- (Short-Term) 5 Day: 444.5 Down Trend,
- (Short-Term) 10 Day: 448.5 Down Trend,
- (Intermediate-Term) 20 Day: 460.75 Down Trend,
- (Intermediate-Term) 55 Day: 482.25 Down Trend,
- (Long-Term) 100 Day: 485.25 Down Trend,
- (Long-Term) 200 Day: 487.5 Down Trend.
Additional Metrics
Recent Trade Signals
- 05 Nov 2026: Short ZC 12-26 @ 440.5 Signals.USAR-MSFG
- 03 Nov 2026: Short ZC 12-26 @ 444.75 Signals.USAR-WSFG
Overall Rating
- Short-Term: Bearish,
- Intermediate-Term: Bearish,
- Long-Term: Bearish.
Key Insights Summary
Price remains in a persistent selloff structure, marked by lower highs, lower lows, a DTrend pivot condition, and trading below every benchmark moving average. The decline has extended beneath the November MSFG neutral zone and toward the 438.50 pivot-low support, while the weekly, monthly, and yearly fib-grid readings remain below their respective F0% areas. The 5-day and 10-day averages are declining overhead near 444.5-448.5, with the 20-day average near 460.75 defining the broader intermediate-term separation from trend. The 438.50-431.00 support band is the active downside reference, while 452.00 is the next pivot-reversal level and the nearest structural level that would interrupt the current short-term sequence.
Chart Analysis ATS AI Generated: 2026-11-07 07:11 for Informational use only, not trading advice. Terms and Risk Disclosure Copyright © 2026. Algo Trading Systems LLC.