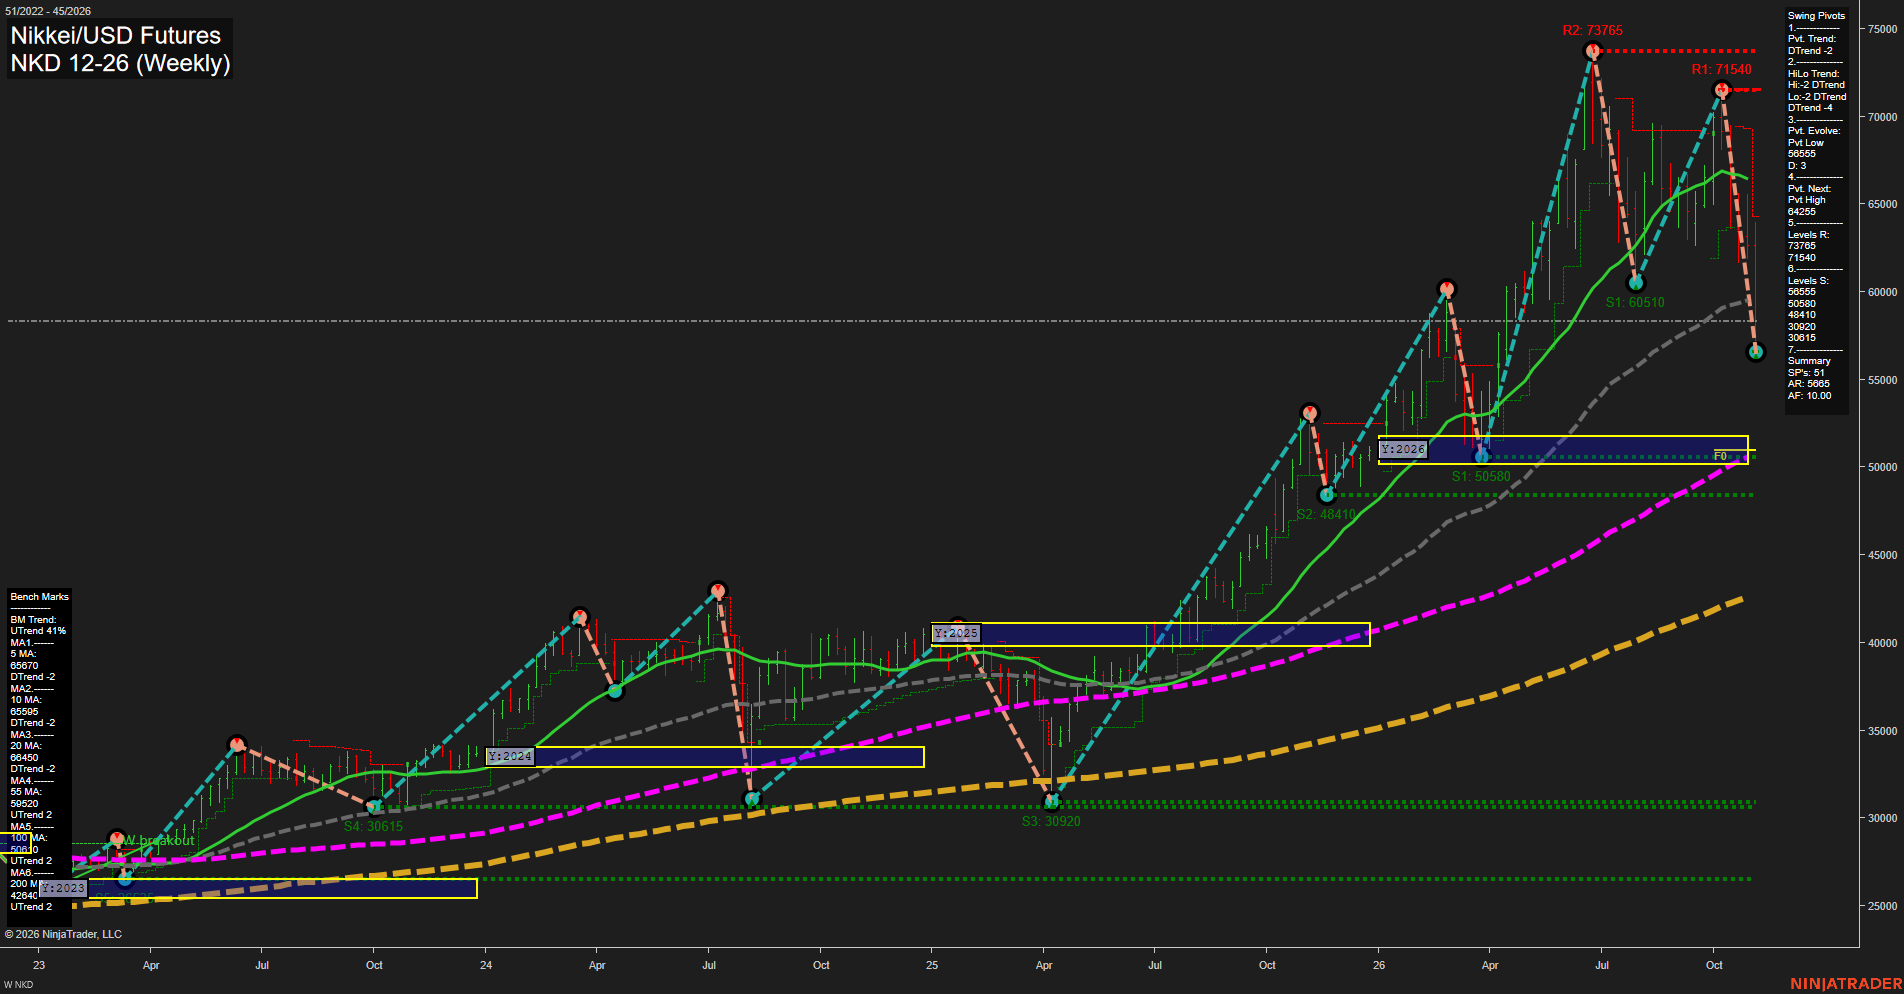
NKD Nikkei/USD Futures Weekly Chart Analysis: 2026-Nov-07 07:06 CT
Price Action
- Last: 56855,
- Bars: Large,
- Mom: fast.
WSFG Weekly
- Short-Term
- WSFG Current: -107%
- F0%/NTZ' Bias: Price Below,
- WSFG Trend: Down.
MSFG Month Nov
- Intermediate-Term
- MSFG Current: -52%
- F0%/NTZ' Bias: Price Below,
- MSFG Trend: Down.
YSFG Year 2026
- Long-Term
- YSFG Current: 91%
- F0%/NTZ' Bias: Price Above,
- YSFG Trend: Up.
Swing Pivots
- (Short-Term) 1. Pvt. Trend: DTrend,
- (Intermediate-Term) 2. HiLo Trend: DTrend,
- 3. Pvt. Evolve: Pvt low 56855,
- 4. Pvt. Next: Pvt high 64255,
- 5. Levels R: 73765, 71540,
- 6. Levels S: 56855, 50580, 48410, 30920, 30815.
Weekly Benchmarks
- (Short-Term) 5 Day: 65670 Down Trend,
- (Short-Term) 10 Day: 65595 Down Trend,
- (Intermediate-Term) 20 Day: 65050 Down Trend,
- (Intermediate-Term) 55 Day: 59520 Up Trend,
- (Long-Term) 100 Day: 50810 Up Trend,
- (Long-Term) 200 Day: 42640 Up Trend.
Recent Trade Signals
- 04 Nov 2026: Long NKD 12-26 @ 63190 Signals.USAR-WSFG
- 04 Nov 2026: Long NKD 12-26 @ 63505 Signals.USAR-MSFG
Overall Rating
- Short-Term: Bearish,
- Intermediate-Term: Bearish,
- Long-Term: Bullish.
Key Insights Summary
NKD has shifted into a fast, large-bar weekly selloff, with price breaking beneath the weekly and monthly Fib-grid neutral zones and falling below the 5, 10, 20, and 55-week benchmarks. The pivot structure is decisively lower on both short- and intermediate-term measures, following rejection from 71540 and the prior 73765 peak. The current 56855 pivot low is the immediate structural reference, while 50580 and 48410 define the next lower support area. Despite the sharp counter-trend decline, the annual grid remains positive and price is still above the rising 100- and 200-week averages, preserving the broader long-term uptrend backdrop.
Chart Analysis ATS AI Generated: 2026-11-07 07:06 for Informational use only, not trading advice. Terms and Risk Disclosure Copyright © 2026. Algo Trading Systems LLC.