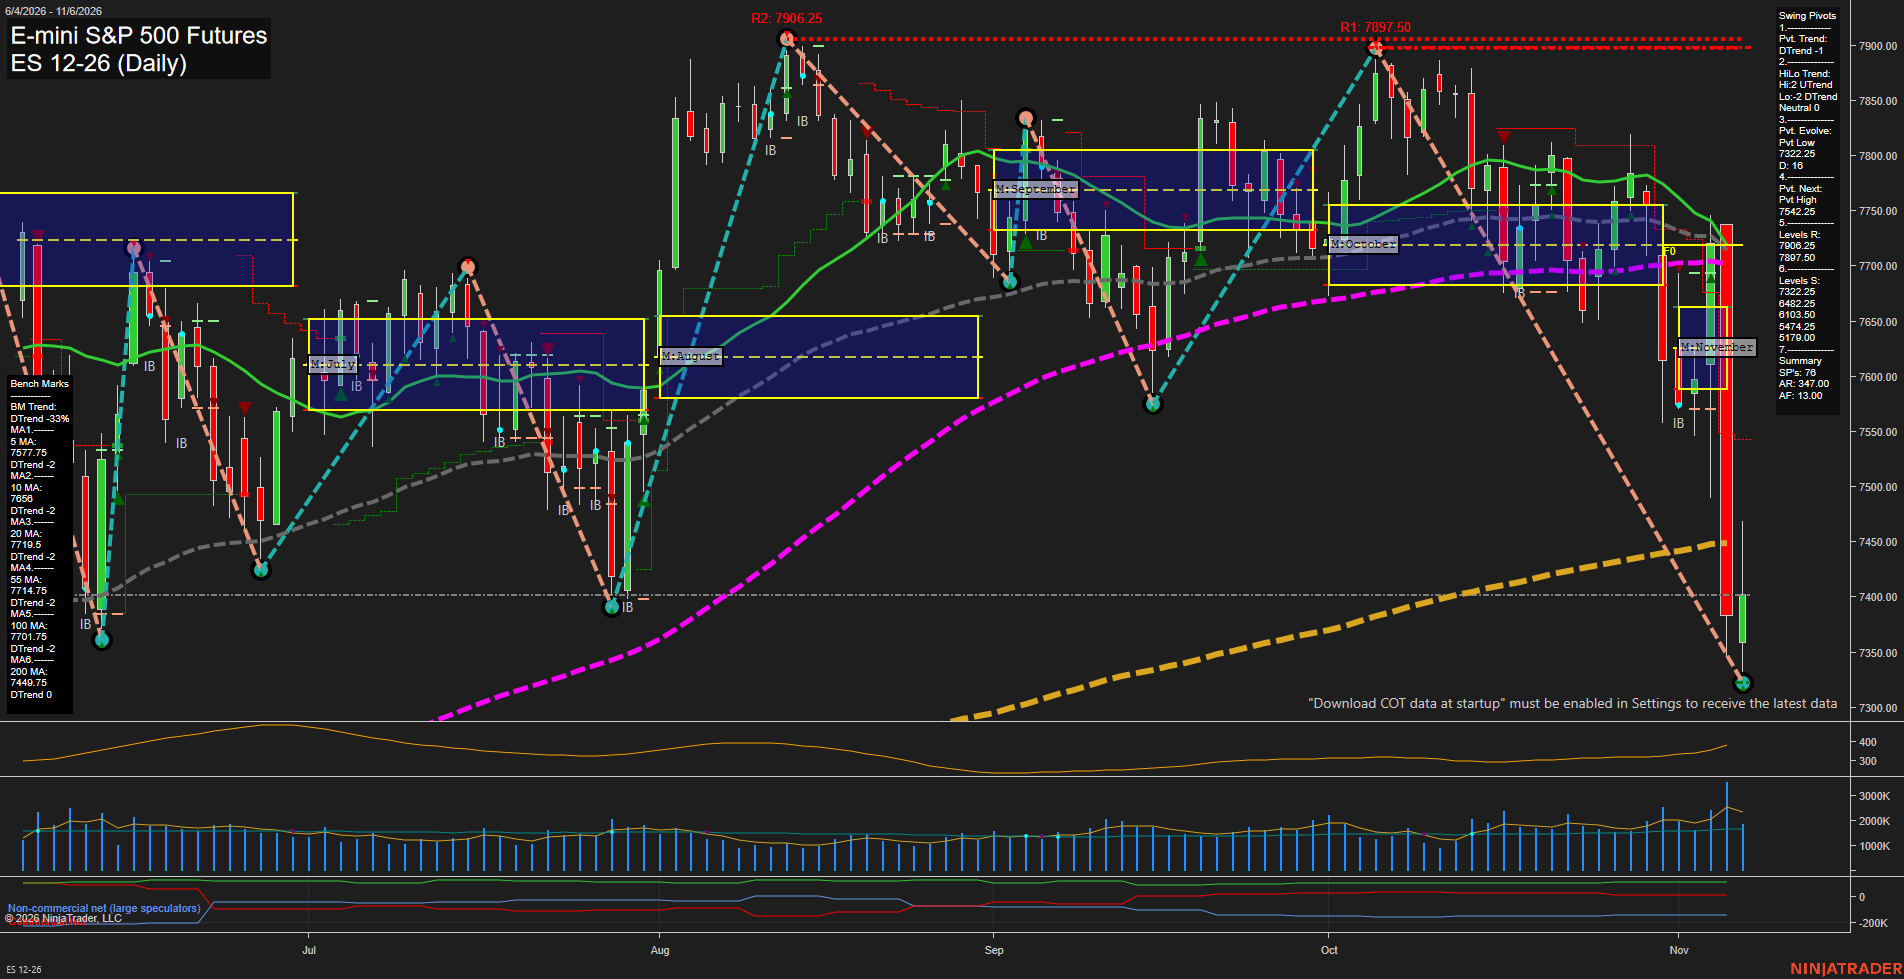
ES E-mini S&P 500 Futures Daily Chart Analysis: 2026-Nov-07 07:03 CT
Price Action
- Last: 7404.00,
- Bars: Large,
- Mom: Fast.
WSFG Weekly
- Short-Term
- WSFG Current: -121%
- F0%/NTZ' Bias: Price Below,
- WSFG Trend: Down.
MSFG Month Nov
- Intermediate-Term
- MSFG Current: -73%
- F0%/NTZ' Bias: Price Below,
- MSFG Trend: Down.
YSFG Year 2026
- Long-Term
- YSFG Current: 24%
- F0%/NTZ' Bias: Price Above,
- YSFG Trend: Up.
Swing Pivots
- (Short-Term) 1. Pvt. Trend: DTrend,
- (Intermediate-Term) 2. HiLo Trend: UTrend,
- 3. Pvt. Evolve: Pvt low 7322.50,
- 4. Pvt. Next: Pvt high 7542.25,
- 5. Levels R: 7906.25, 7897.50,
- 6. Levels S: 7522.25, 6483.25, 6103.50, 5474.25, 5179.00.
Daily Benchmarks
- (Short-Term) 5 Day: 7577.75 Down Trend,
- (Short-Term) 10 Day: 7658.00 Down Trend,
- (Intermediate-Term) 20 Day: 7719.50 Down Trend,
- (Intermediate-Term) 55 Day: 7714.75 Down Trend,
- (Long-Term) 100 Day: 7701.75 Down Trend,
- (Long-Term) 200 Day: 7449.75 Down Trend.
Additional Metrics
- ATR: 319,
- VOLMA: 1611996.
Recent Trade Signals
- 05 Nov 2026: Short ES 12-26 @ 7593.75 Signals.USAR-WSFG
- 04 Nov 2026: Long ES 12-26 @ 7674.75 Signals.USAR-MSFG
Overall Rating
- Short-Term: Bearish,
- Intermediate-Term: Bearish,
- Long-Term: Bearish.
Key Insights Summary
The daily structure reflects a high-volatility downside impulse, with large-range selling pushing price beneath the weekly and monthly F0%/NTZ areas and below every tracked daily benchmark. The short-term pivot trend is down, while the developing 7322.50 pivot low defines the latest washout extreme and 7542.25 is the next pivot-reversal reference. Intermediate structure remains conflicted because the HiLo trend is still up, but the monthly grid, declining 20/55-day averages, and lower-price acceptance favor a countertrend-retracement interpretation rather than a confirmed recovery. The 7400 area and declining 200-day average near 7449.75 form an important nearby technical zone, while 7522.25 is the closest listed swing resistance. The annual grid remains positive, indicating that the broader 2026 advance has not fully reversed, although the current sharp selloff has materially weakened the long-term daily moving-average profile.
Chart Analysis ATS AI Generated: 2026-11-07 07:03 for Informational use only, not trading advice. Terms and Risk Disclosure Copyright © 2026. Algo Trading Systems LLC.