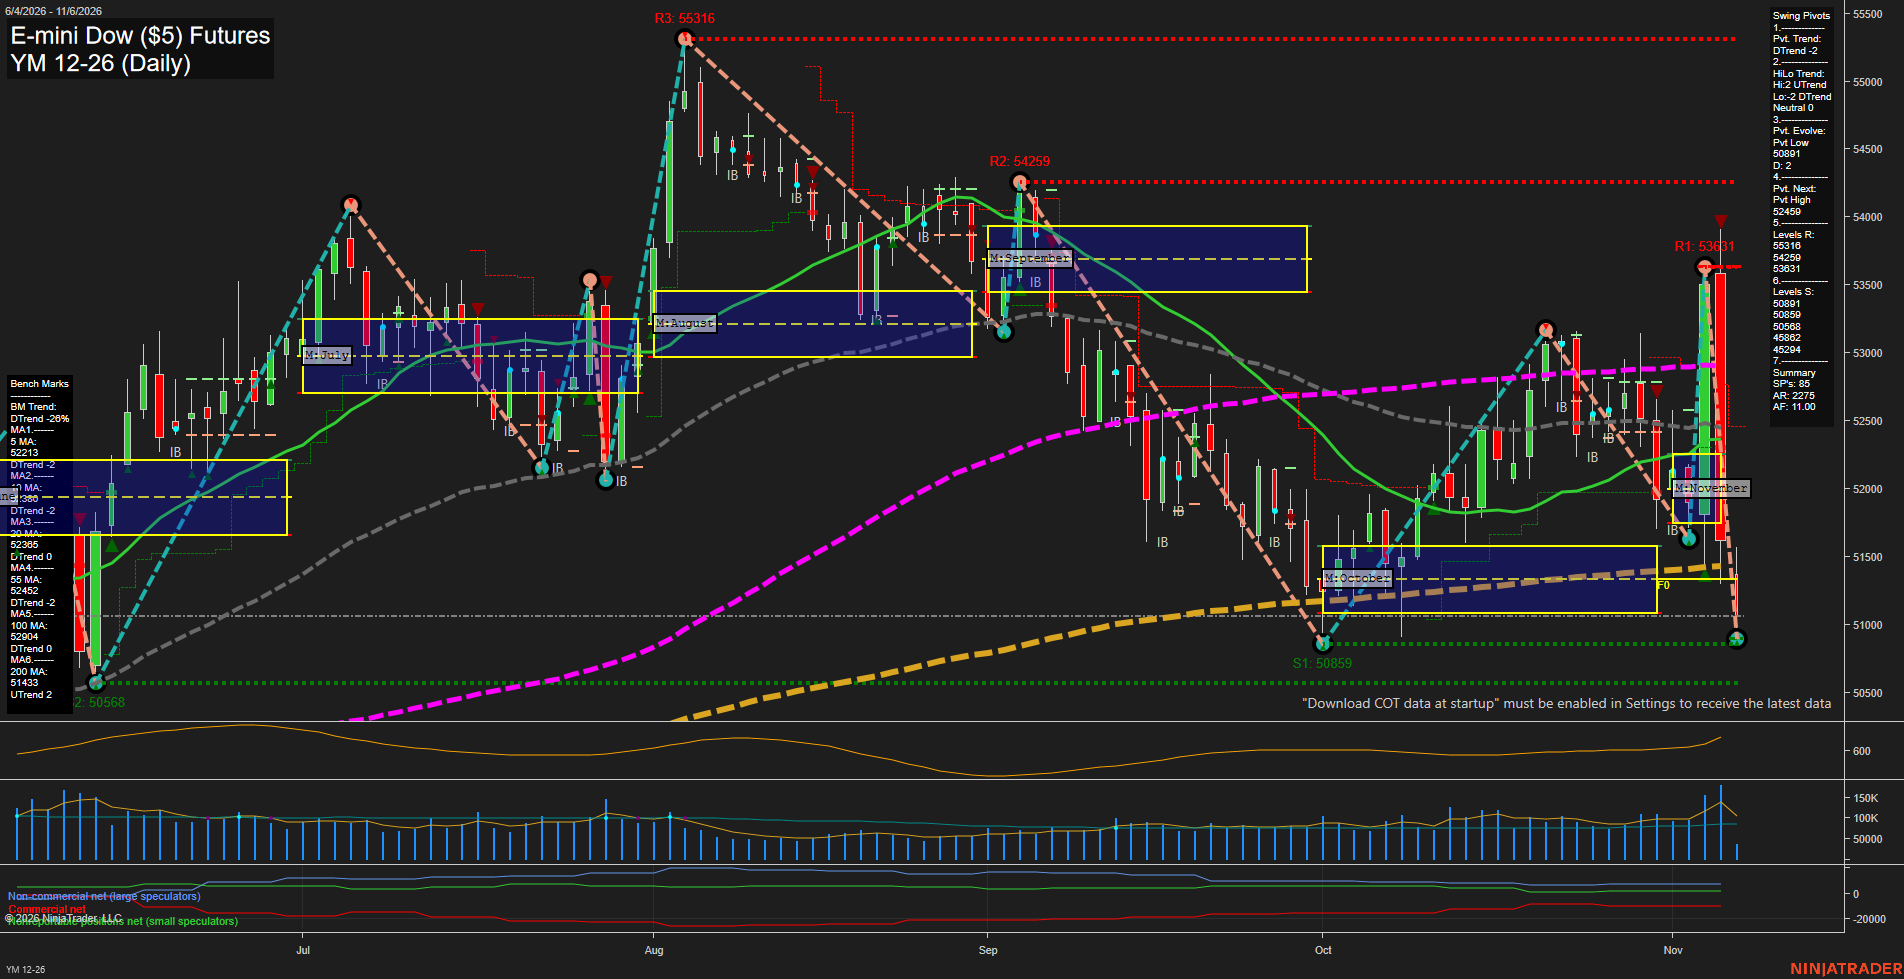
YM E-mini Dow ($5) Futures Daily Chart Analysis: 2026-Nov-06 07:11 CT
Price Action
- Last: 51000,
- Bars: Large,
- Mom: fast.
WSFG Weekly
- Short-Term
- WSFG Current: -78%
- F0%/NTZ' Bias: Price Below,
- WSFG Trend: Down.
MSFG Month Nov
- Intermediate-Term
- MSFG Current: -43%
- F0%/NTZ' Bias: Price Below,
- MSFG Trend: Down.
YSFG Year 2026
- Long-Term
- YSFG Current: 13%
- F0%/NTZ' Bias: Price Above,
- YSFG Trend: Up.
Swing Pivots
- (Short-Term) 1. Pvt. Trend: DTrend,
- (Intermediate-Term) 2. HiLo Trend: UTrend,
- 3. Pvt. Evolve: Pvt low 50899,
- 4. Pvt. Next: Pvt high 52459,
- 5. Levels R: 55316, 54259, 53631,
- 6. Levels S: 50891, 50859, 50568.
Daily Benchmarks
- (Short-Term) 5 Day: 52213 Down Trend,
- (Short-Term) 10 Day: 52380 Down Trend,
- (Intermediate-Term) 20 Day: 52380 Down Trend,
- (Intermediate-Term) 55 Day: 52452 Down Trend,
- (Long-Term) 100 Day: 52530 Down Trend,
- (Long-Term) 200 Day: 51433 Up Trend.
Additional Metrics
Recent Trade Signals
- 05 Nov 2026: Short YM 12-26 @ 51607 Signals.USAR-MSFG
- 05 Nov 2026: Short YM 12-26 @ 51874 Signals.USAR-WSFG
Overall Rating
- Short-Term: Bearish,
- Intermediate-Term: Bearish,
- Long-Term: Bullish.
Key Insights Summary
Price action has transitioned into a fast, high-range selloff, with the short-term pivot structure in a DTrend and price materially below the weekly and monthly fib-grid centers. The decline has broken beneath all short- and intermediate-term benchmarks, while the 5-, 10-, 20-, 55-, and 100-day averages are aligned lower. The 50891-50859 pivot-support area is the immediate structural reference, with 50568 as the next lower support. The larger 2026 structure remains constructive because price is still above the annual fib center and the rising 200-day benchmark, but the current swing phase is a sharp countertrend retracement within that longer-term uptrend. A recovery through the 52459 next-pivot level would be needed to alter the current short-term bearish pivot condition.
Chart Analysis ATS AI Generated: 2026-11-06 07:11 for Informational use only, not trading advice. Terms and Risk Disclosure Copyright © 2026. Algo Trading Systems LLC.