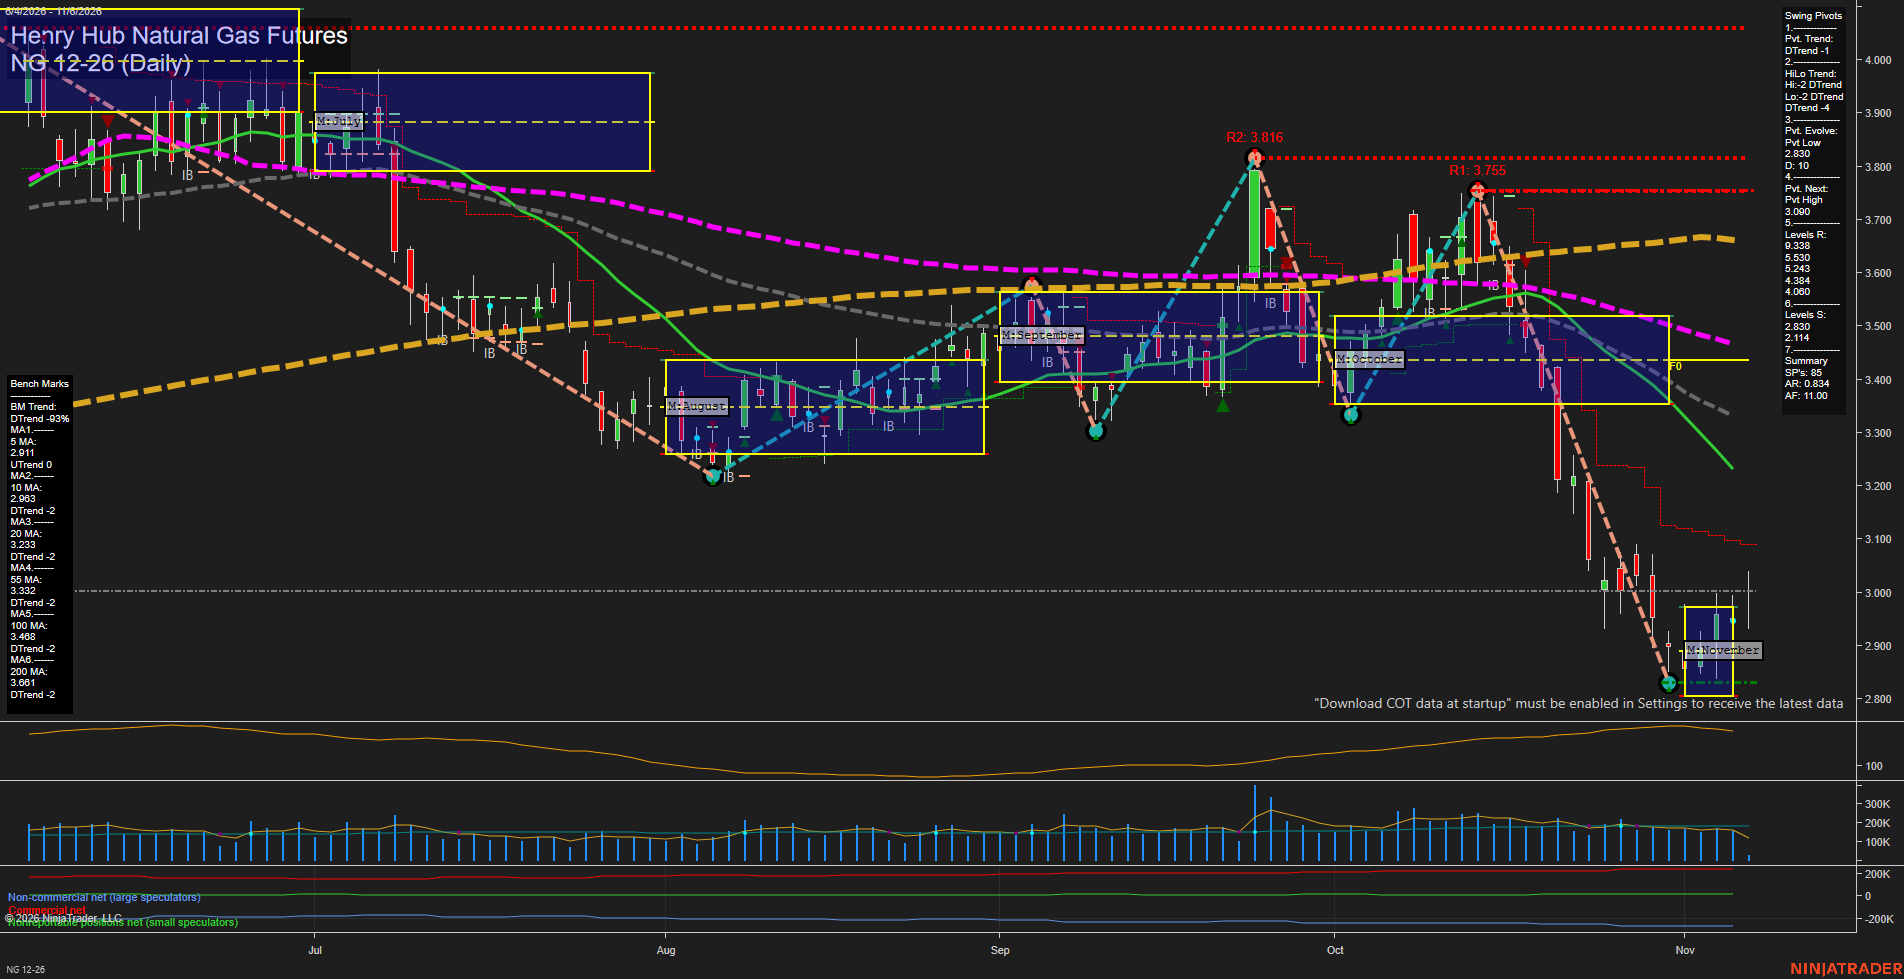
NG Henry Hub Natural Gas Futures Daily Chart Analysis: 2026-Nov-06 07:06 CT
Price Action
- Last: 3.003,
- Bars: Small,
- Mom: fast.
WSFG Weekly
- Short-Term
- WSFG Current: -78%
- F0%/NTZ' Bias: Price Below,
- WSFG Trend: Down.
MSFG Month Nov
- Intermediate-Term
- MSFG Current: -32%
- F0%/NTZ' Bias: Price Below,
- MSFG Trend: Down.
YSFG Year 2026
- Long-Term
- YSFG Current: 8%
- F0%/NTZ' Bias: Price Above,
- YSFG Trend: Up.
Swing Pivots
- (Short-Term) 1. Pvt. Trend: DTrend,
- (Intermediate-Term) 2. HiLo Trend: DTrend,
- 3. Pvt. Evolve: Pvt low 2.830,
- 4. Pvt. Next: Pvt high 3.090,
- 5. Levels R: 3.830, 3.530, 3.384, 3.243, 3.060,
- 6. Levels S: 2.830, 2.114.
Daily Benchmarks
- (Short-Term) 5 Day: 2.910 Up Trend,
- (Short-Term) 10 Day: 2.963 Down Trend,
- (Intermediate-Term) 20 Day: 3.239 Down Trend,
- (Intermediate-Term) 55 Day: 3.332 Down Trend,
- (Long-Term) 100 Day: 3.469 Down Trend,
- (Long-Term) 200 Day: 3.661 Down Trend.
Additional Metrics
Recent Trade Signals
- 05 Nov 2026: Long NG 12-26 @ 2.95 Signals.USAR-WSFG
- 05 Nov 2026: Long NG 12-26 @ 2.956 Signals.USAR-MSFG
Overall Rating
- Short-Term: Bearish,
- Intermediate-Term: Bearish,
- Long-Term: Bearish.
Key Insights Summary
Price is attempting to stabilize just above the 2.830 pivot-low support after a fast, high-volatility liquidation from the October highs. The rebound into 3.003 remains a counter-trend bounce within confirmed short- and intermediate-term DTrends: price is below the weekly and monthly Fib-grid centers and below every benchmark from the 10-day through 200-day averages. The 5-day average has turned higher, reflecting near-term bounce momentum, but the 3.060 to 3.090 area is the first pivot-based overhead test. The broader structure remains lower highs and lower lows, with 2.830 the immediate swing reference and 2.114 the next major support below it. Seasonal winter demand can sustain abrupt price swings, while current technical positioning remains defined by a deeply extended decline and an early attempt to form a base.
Chart Analysis ATS AI Generated: 2026-11-06 07:06 for Informational use only, not trading advice. Terms and Risk Disclosure Copyright © 2026. Algo Trading Systems LLC.