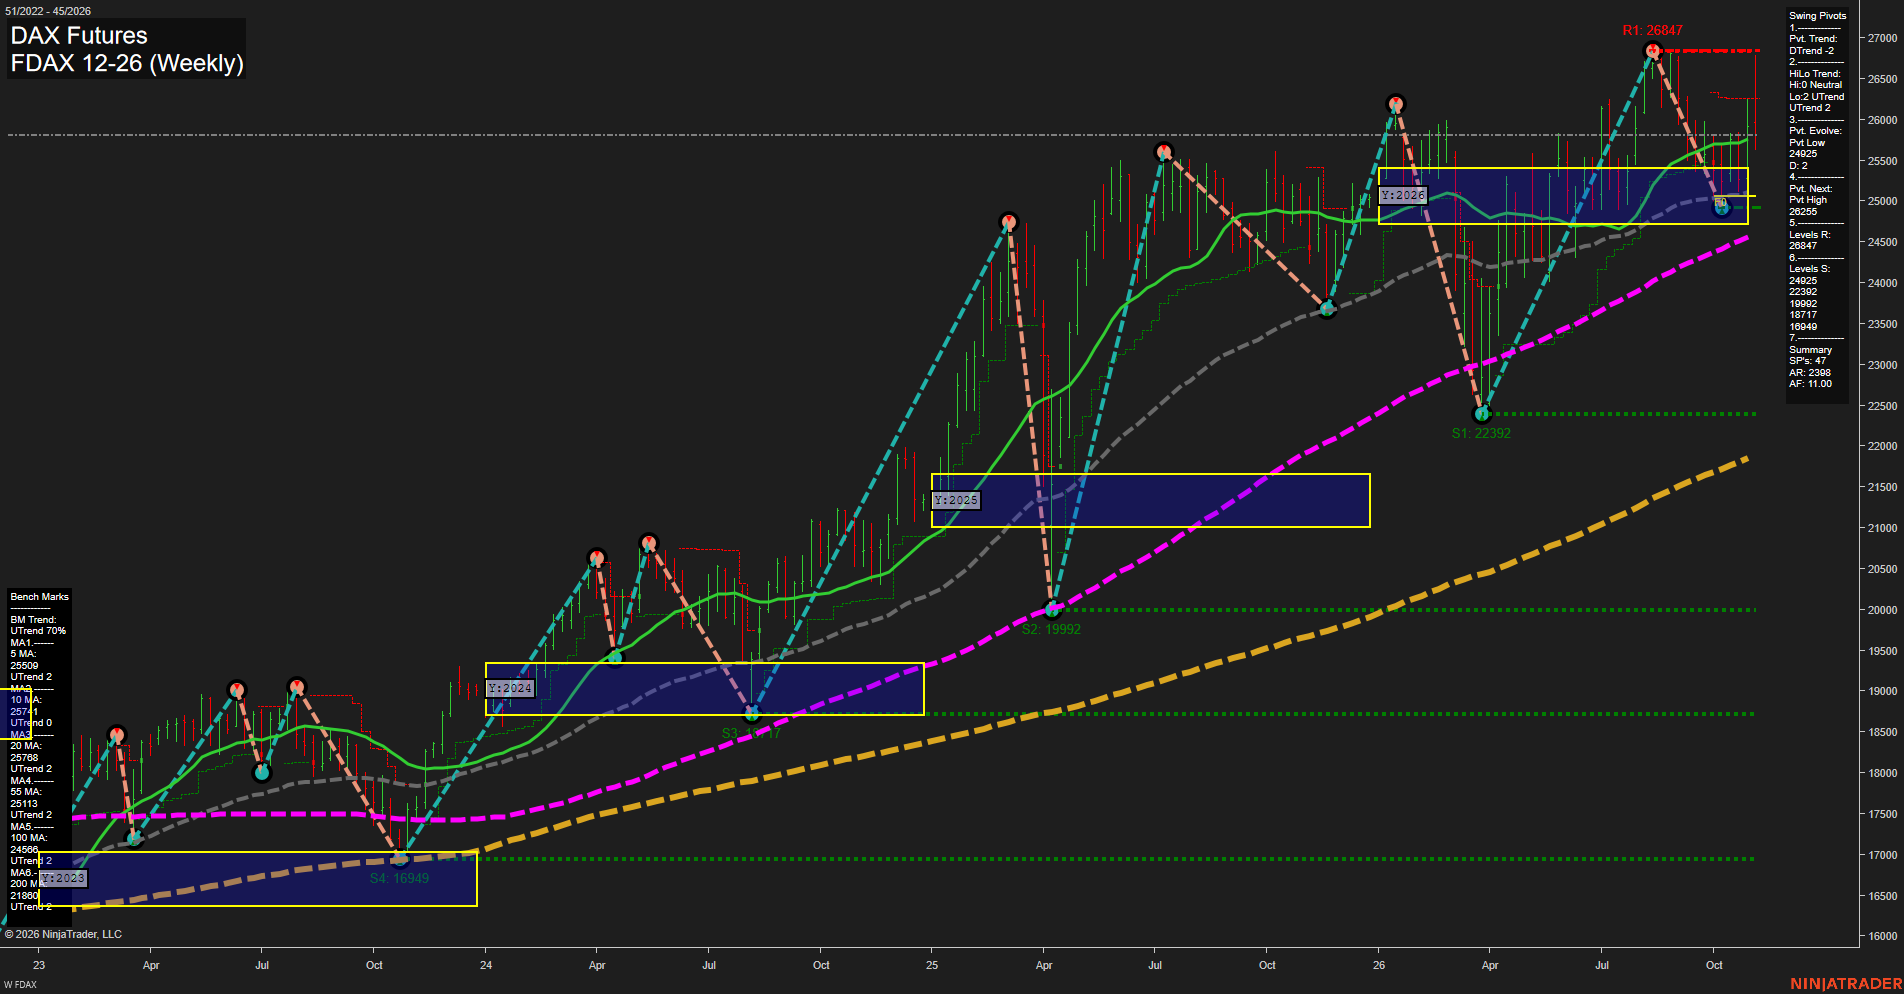
FDAX DAX Futures Weekly Chart Analysis: 2026-Nov-06 07:04 CT
Price Action
- Last: 25803,
- Bars: Medium,
- Mom: average.
WSFG Weekly
- Short-Term
- WSFG Current: -27%
- F0%/NTZ' Bias: Price Below,
- WSFG Trend: Down.
MSFG Month Nov
- Intermediate-Term
- MSFG Current: -16%
- F0%/NTZ' Bias: Price Below,
- MSFG Trend: Down.
YSFG Year 2026
- Long-Term
- YSFG Current: 20%
- F0%/NTZ' Bias: Price Above,
- YSFG Trend: Up.
Swing Pivots
- (Short-Term) 1. Pvt. Trend: DTrend,
- (Intermediate-Term) 2. HiLo Trend: UTrend,
- 3. Pvt. Evolve: Pvt low 24925,
- 4. Pvt. Next: Pvt high 26255,
- 5. Levels R: 26847,
- 6. Levels S: 24925, 23992, 19992, 18717, 16949.
Weekly Benchmarks
- (Short-Term) 5 Day: 25599 Up Trend,
- (Short-Term) 10 Day: 25741 Up Trend,
- (Intermediate-Term) 20 Day: 25768 Up Trend,
- (Intermediate-Term) 55 Day: 25113 Up Trend,
- (Long-Term) 100 Day: 24568 Up Trend,
- (Long-Term) 200 Day: 21809 Up Trend.
Recent Trade Signals
- 06 Nov 2026: Short FDAX 12-26 @ 25803 Signals.USAR-MSFG
- 06 Nov 2026: Short FDAX 12-26 @ 25803 Signals.USAR-WSFG
Overall Rating
- Short-Term: Bearish,
- Intermediate-Term: Bullish,
- Long-Term: Bullish.
Key Insights Summary
The weekly chart shows a short-term pullback within a broader bullish structure. Price is below the weekly and monthly fib-grid centers, while the active pivot sequence is in DTrend following rejection from the 26847 resistance area. The 24925 pivot low is the nearest structural support, with 23992 representing the next deeper swing reference. Despite the current corrective phase, price remains above the rising 20-, 55-, 100-, and 200-period benchmarks, and the yearly fib-grid remains positive. This creates a mixed swing profile: short-term downside rotation and lower-high behavior are developing beneath 26255, while the intermediate and long-term trend framework remains supported by rising moving averages and higher-level yearly positioning.
Chart Analysis ATS AI Generated: 2026-11-06 07:04 for Informational use only, not trading advice. Terms and Risk Disclosure Copyright © 2026. Algo Trading Systems LLC.