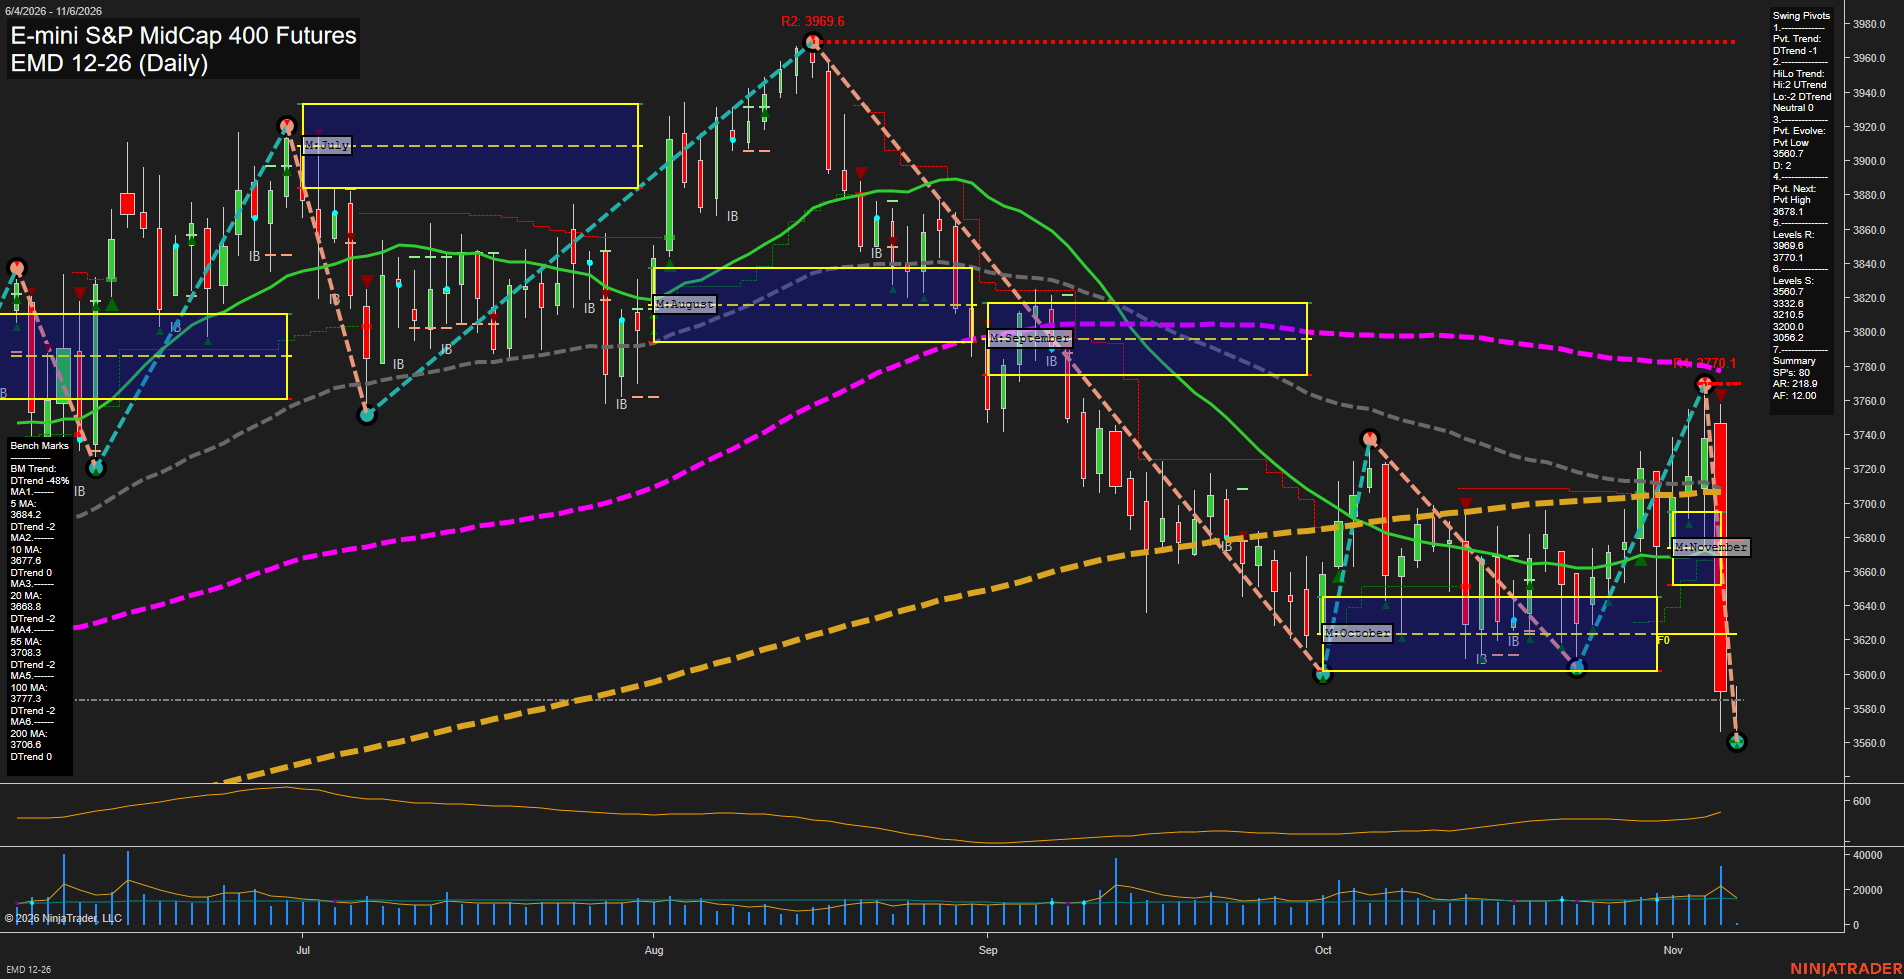
EMD E-mini S&P MidCap 400 Futures Daily Chart Analysis: 2026-Nov-06 07:03 CT
Price Action
- Last: 3560.9,
- Bars: Large,
- Mom: Fast.
WSFG Weekly
- Short-Term
- WSFG Current: -100%
- F0%/NTZ' Bias: Price Below,
- WSFG Trend: Down.
MSFG Month Nov
- Intermediate-Term
- MSFG Current: -58%
- F0%/NTZ' Bias: Price Below,
- MSFG Trend: Down.
YSFG Year 2026
- Long-Term
- YSFG Current: 17%
- F0%/NTZ' Bias: Price Above,
- YSFG Trend: Up.
Swing Pivots
- (Short-Term) 1. Pvt. Trend: DTrend,
- (Intermediate-Term) 2. HiLo Trend: UTrend,
- 3. Pvt. Evolve: Pvt low 3560.9,
- 4. Pvt. Next: Pvt high 3678.1,
- 5. Levels R: 3969.6 3770.1,
- 6. Levels S: 3560.7 3332.6 3210.5 3200.0 3056.2.
Daily Benchmarks
- (Short-Term) 5 Day: 3684.2 Down Trend,
- (Short-Term) 10 Day: 3677.6 Down Trend,
- (Intermediate-Term) 20 Day: 3688.8 Down Trend,
- (Intermediate-Term) 55 Day: 3708.3 Down Trend,
- (Long-Term) 100 Day: 3777.3 Down Trend,
- (Long-Term) 200 Day: 3706.8 Down Trend.
Additional Metrics
- ATR: 218.9,
- VOLMA: 13383.
Recent Trade Signals
- 03 Nov 2026: Long EMD 12-26 @ 3702.5 Signals.USAR-MSFG
Overall Rating
- Short-Term: Bearish,
- Intermediate-Term: Bearish,
- Long-Term: Bearish.
Key Insights Summary
Price action completed a sharp reversal from the early-November rally and closed near the developing 3560.7 swing-low support, producing a large downside bar with fast bearish momentum. The short-term pivot structure is in DTrend and price is below the weekly and monthly Fib-grid centers, while all daily benchmark averages remain in down trends and overhead. The intermediate HiLo structure remains UTrend, but the current decline has materially weakened that broader sequence. The 3560.7 pivot support is the immediate technical focal point; 3678.1 is the next pivot reversal threshold, followed by 3770.1 resistance. Below the current swing low, the support map opens toward 3332.6, while the 3969.6 pivot high remains the major overhead resistance reference.
Chart Analysis ATS AI Generated: 2026-11-06 07:03 for Informational use only, not trading advice. Terms and Risk Disclosure Copyright © 2026. Algo Trading Systems LLC.