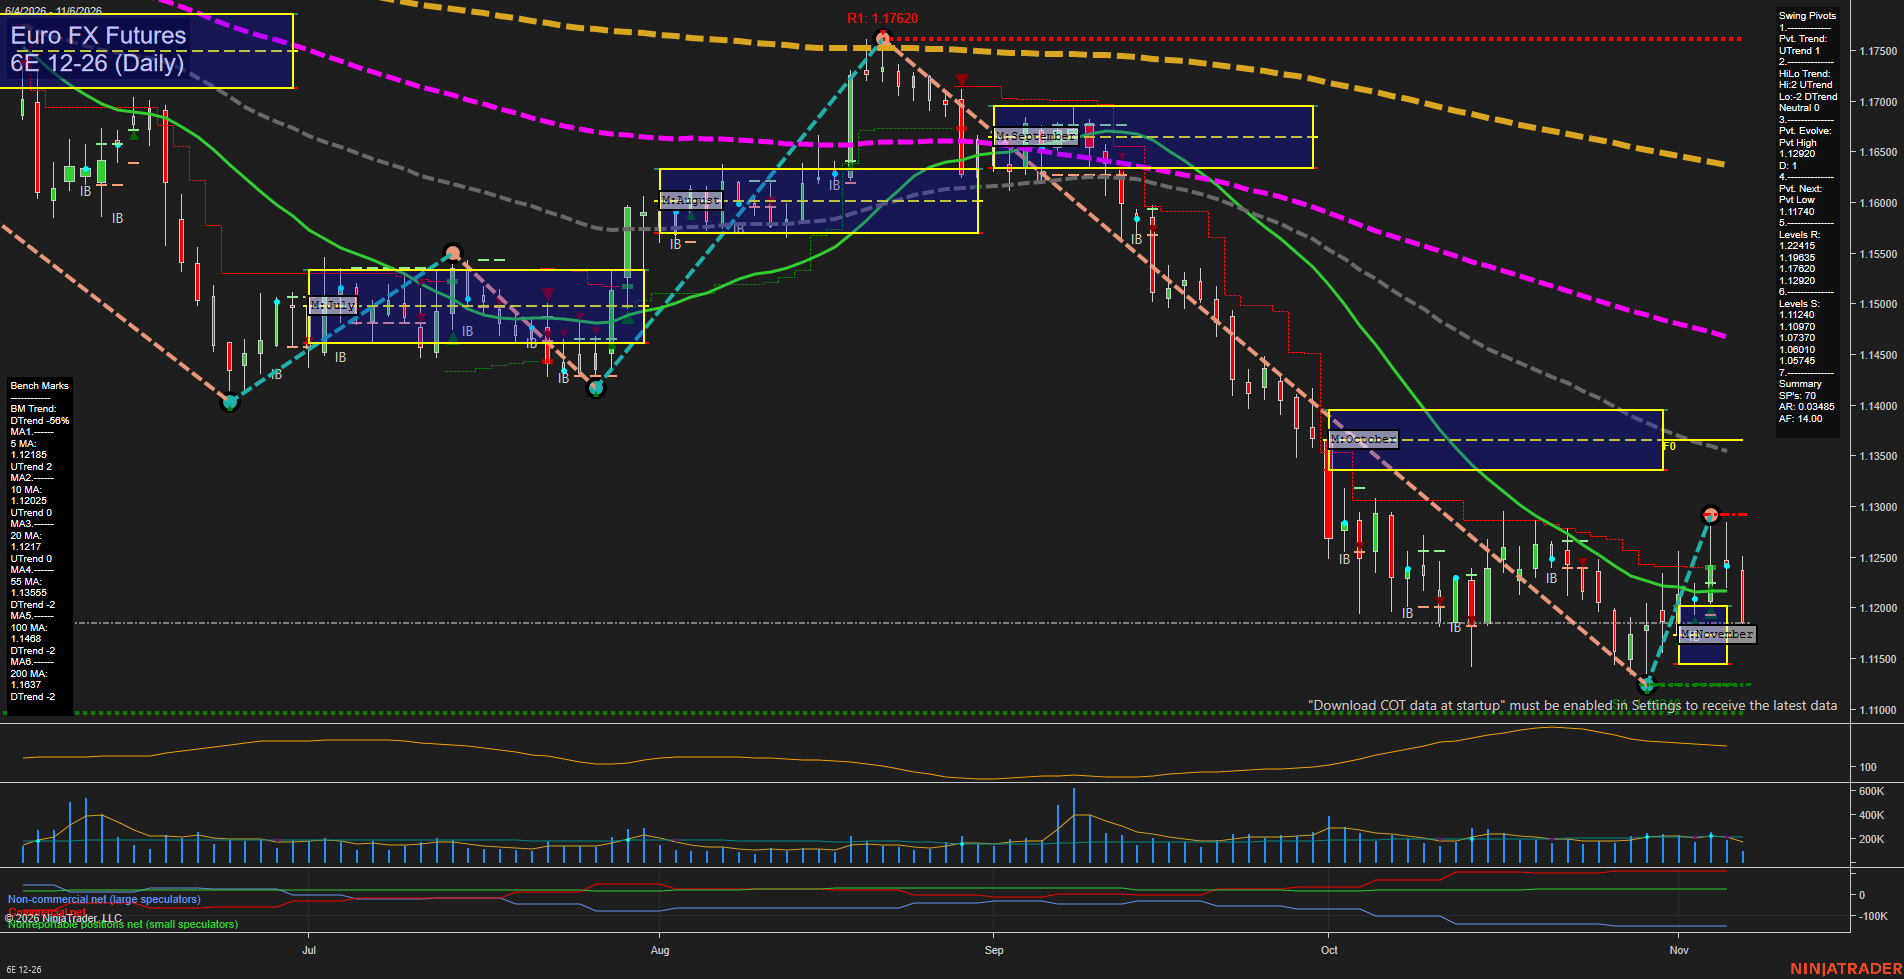
6E Euro FX Futures Daily Chart Analysis: 2026-Nov-06 07:01 CT
Price Action
- Last: 1.11885,
- Bars: Small,
- Mom: average.
WSFG Weekly
- Short-Term
- WSFG Current: 10%
- F0%/NTZ' Bias: Price Above,
- WSFG Trend: Up.
MSFG Month Nov
- Intermediate-Term
- MSFG Current: 4%
- F0%/NTZ' Bias: Price Above,
- MSFG Trend: Up.
YSFG Year 2026
- Long-Term
- YSFG Current: -59%
- F0%/NTZ' Bias: Price Below,
- YSFG Trend: Down.
Swing Pivots
- (Short-Term) 1. Pvt. Trend: UTrend,
- (Intermediate-Term) 2. HiLo Trend: DTrend,
- 3. Pvt. Evolve: Pvt high 1.12920,
- 4. Pvt. Next: Pvt low 1.11470,
- 5. Levels R: 1.17620, 1.16452, 1.12920, 1.12415,
- 6. Levels S: 1.11280, 1.10970, 1.07370, 1.06745.
Daily Benchmarks
- (Short-Term) 5 Day: 1.12185 Up Trend,
- (Short-Term) 10 Day: 1.12025 Up Trend,
- (Intermediate-Term) 20 Day: 1.12417 Up Trend,
- (Intermediate-Term) 55 Day: 1.13555 Down Trend,
- (Long-Term) 100 Day: 1.14682 Down Trend,
- (Long-Term) 200 Day: 1.16370 Down Trend.
Additional Metrics
Recent Trade Signals
- 03 Nov 2026: Long 6E 12-26 @ 1.12095 Signals.USAR-MSFG
Overall Rating
- Short-Term: Bullish,
- Intermediate-Term: Neutral,
- Long-Term: Bearish.
Key Insights Summary
The daily chart reflects a short-term rebound from the 1.11280 area, with the pivot trend and 5-day and 10-day benchmarks improving. Price remains below the 20-day benchmark and substantially beneath the declining 55-day, 100-day, and 200-day averages, defining the recovery as counter-trend within the broader decline. The 1.12920 pivot high is the immediate structural resistance, while 1.11470 and 1.11280 define the nearby downside pivot and support zone. Small daily bars and moderating momentum indicate consolidation after the sharp October selloff rather than a broad expansion in directional momentum.
Chart Analysis ATS AI Generated: 2026-11-06 07:01 for Informational use only, not trading advice. Terms and Risk Disclosure Copyright © 2026. Algo Trading Systems LLC.