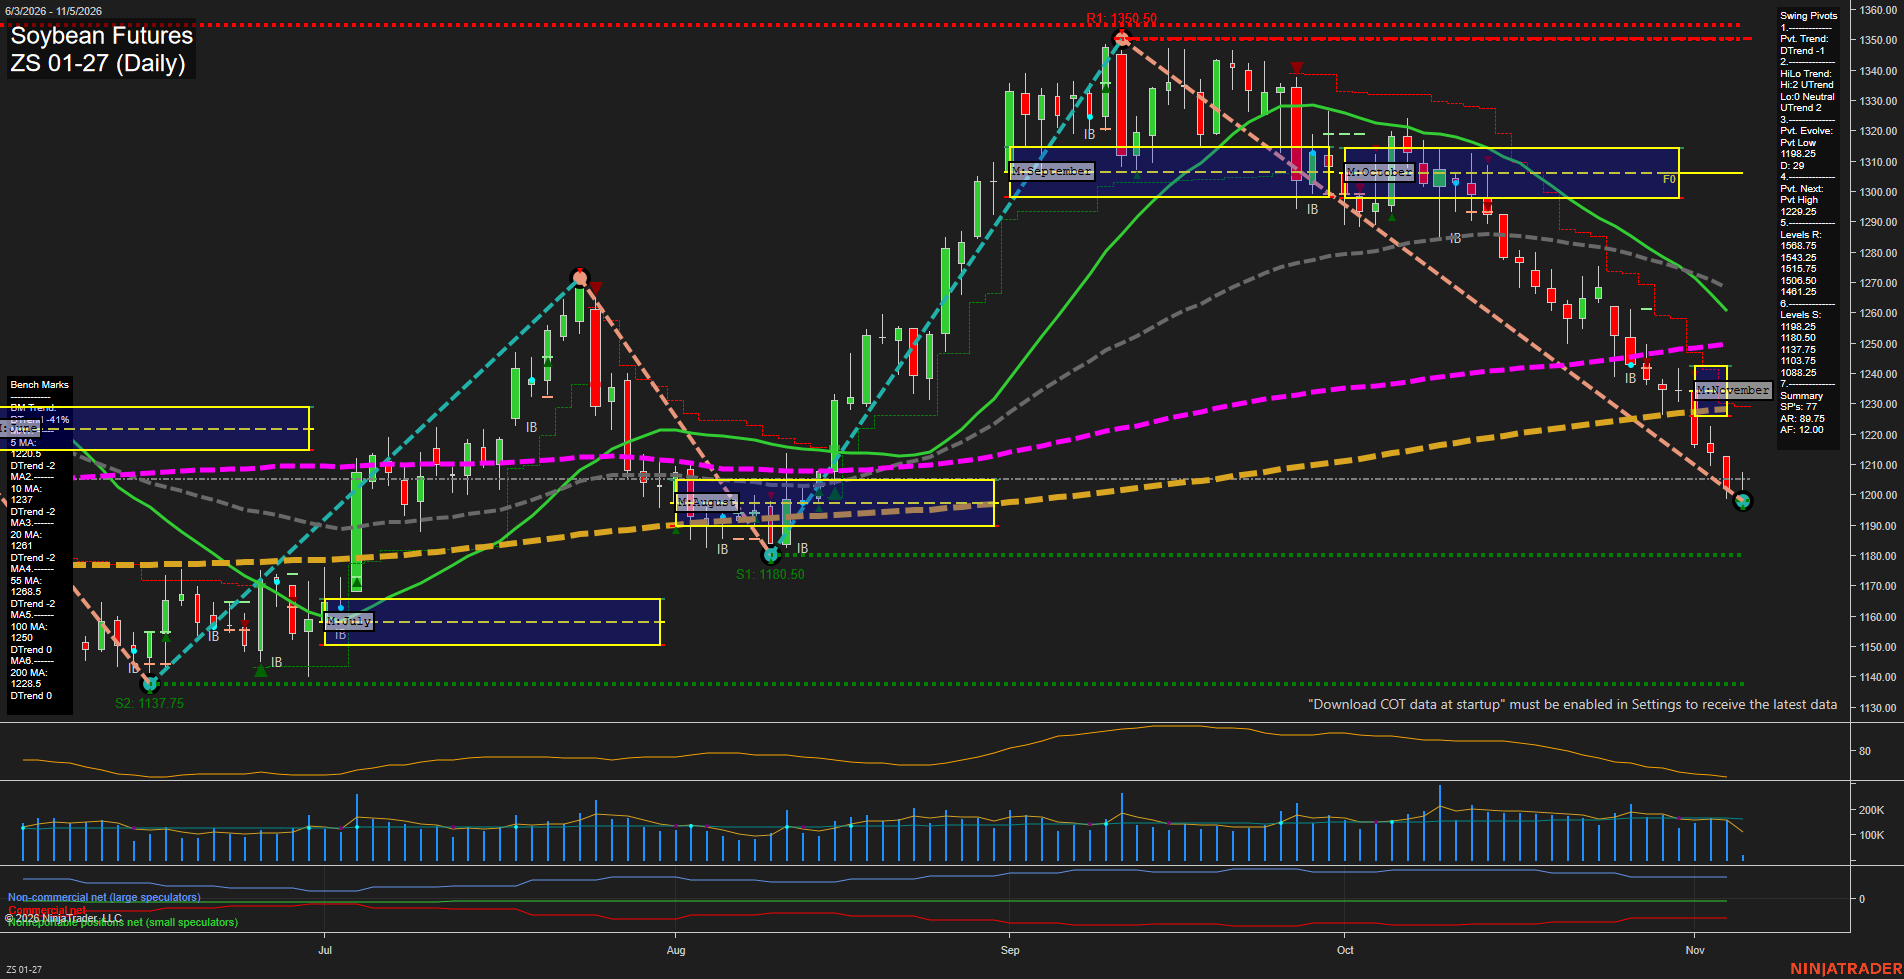
ZS Soybean Futures Daily Chart Analysis: 2026-Nov-05 07:12 CT
Price Action
- Last: 1198.25,
- Bars: Small,
- Mom: Fast.
WSFG Weekly
- Short-Term
- WSFG Current: -41%
- F0%/NTZ' Bias: Price Below,
- WSFG Trend: Down.
MSFG Month Nov
- Intermediate-Term
- MSFG Current: -31%
- F0%/NTZ' Bias: Price Below,
- MSFG Trend: Down.
YSFG Year 2026
- Long-Term
- YSFG Current: 22%
- F0%/NTZ' Bias: Price Above,
- YSFG Trend: Up.
Swing Pivots
- (Short-Term) 1. Pvt. Trend: DTrend,
- (Intermediate-Term) 2. HiLo Trend: UTrend,
- 3. Pvt. Evolve: Pvt low 1198.25,
- 4. Pvt. Next: Pvt high 1229.25,
- 5. Levels R: 1568.75, 1543.25, 1515.75, 1468.50, 1461.25,
- 6. Levels S: 1198.25, 1180.50, 1173.75, 1103.75, 1083.25.
Daily Benchmarks
- (Short-Term) 5 Day: 1220.50 Down Trend,
- (Short-Term) 10 Day: 1237.00 Down Trend,
- (Intermediate-Term) 20 Day: 1261.00 Down Trend,
- (Intermediate-Term) 55 Day: 1268.50 Down Trend,
- (Long-Term) 100 Day: 1250.00 Down Trend,
- (Long-Term) 200 Day: 1228.50 Down Trend.
Additional Metrics
- ATR: 89.75,
- VOLMA: 155181.
Recent Trade Signals
- 03 Nov 2026: Short ZS 01-27 @ 1219 Signals.USAR-MSFG
- 28 Oct 2026: Short ZS 01-27 @ 1244.25 Signals.USAR-WSFG
Overall Rating
- Short-Term: Bearish,
- Intermediate-Term: Bearish,
- Long-Term: Neutral.
Key Insights Summary
Price is in a fast short-term decline, printing below the weekly and monthly Fib-grid balance areas and beneath every daily benchmark. The newly evolving pivot low at 1198.25 confirms the DTrend, while 1180.50 and 1173.75 define the next lower support structure. Intermediate structure remains conflicted by the UTrend HiLo reading, but declining 20- and 55-day averages and rejection below the October grid favor a bearish retracement phase. The annual grid remains positive, leaving the longer-term cycle neutral rather than decisively bearish.
Chart Analysis ATS AI Generated: 2026-11-05 07:12 for Informational use only, not trading advice. Terms and Risk Disclosure Copyright © 2026. Algo Trading Systems LLC.