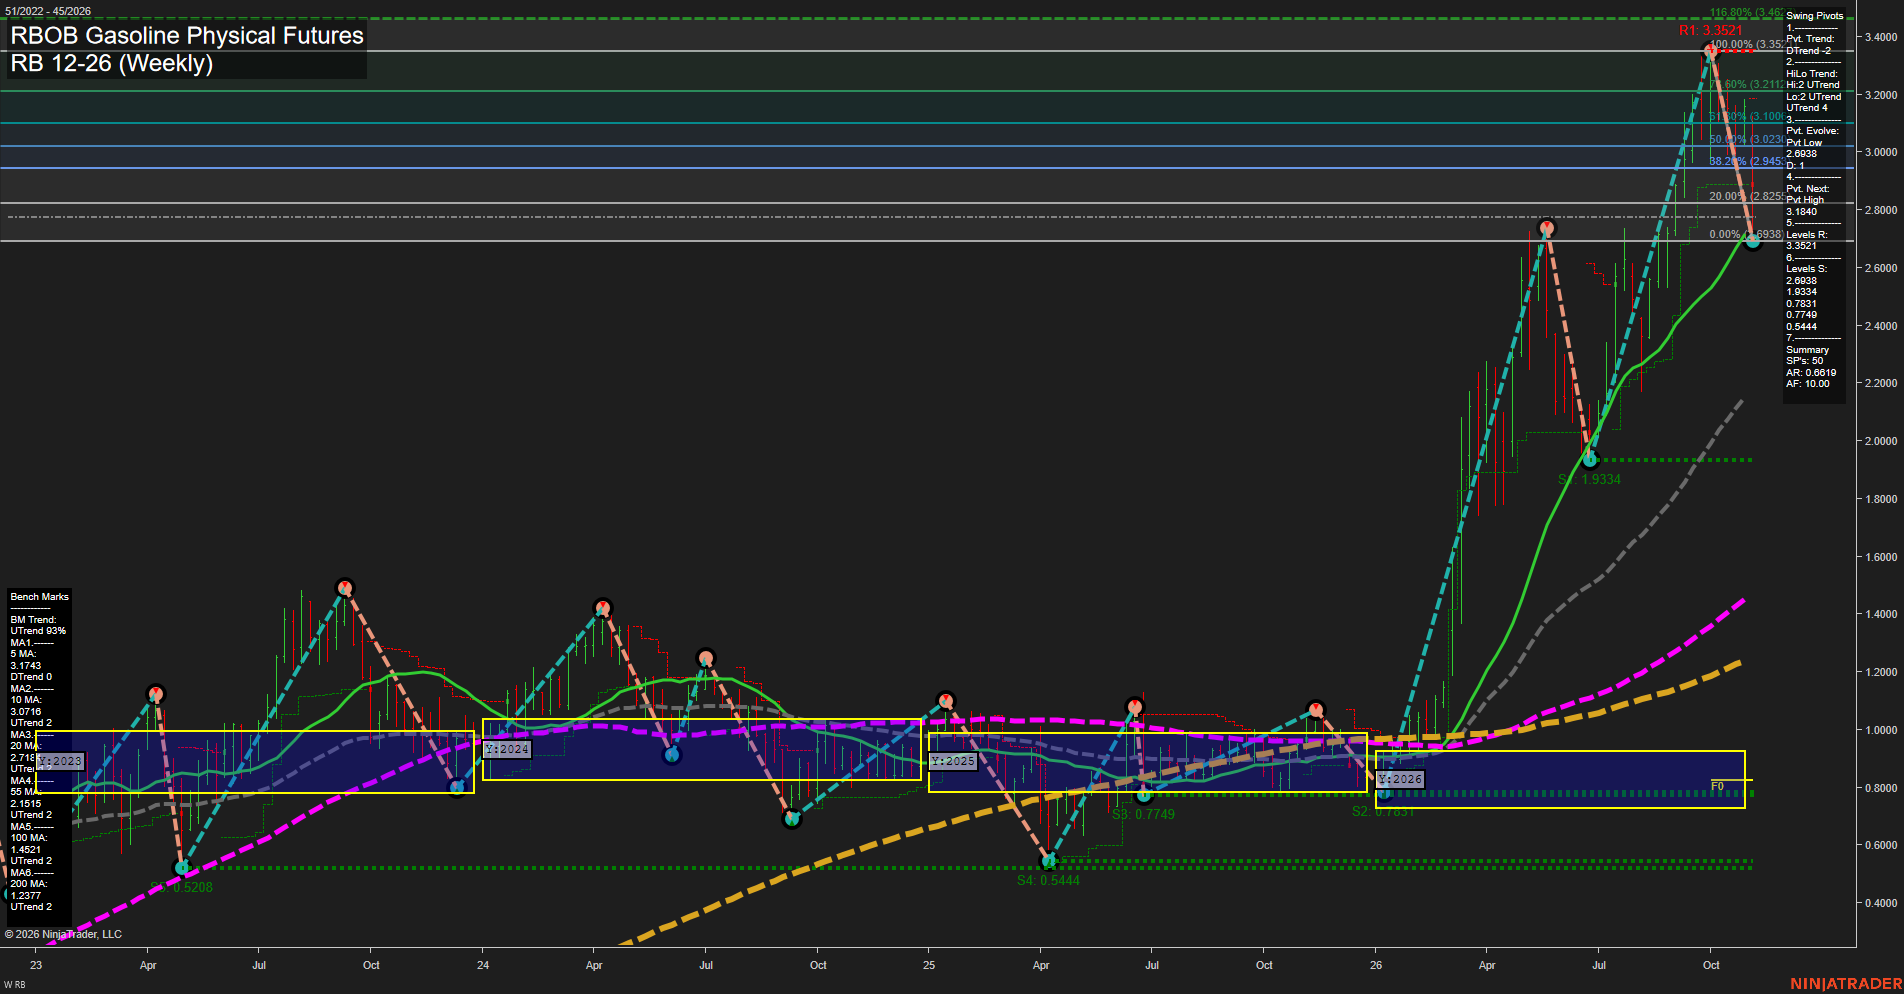
RB RBOB Gasoline Physical Futures Weekly Chart Analysis: 2026-Nov-05 07:08 CT
Price Action
- Last: 3.3521,
- Bars: Large,
- Mom: Fast.
WSFG Weekly
- Short-Term
- WSFG Current: -170%
- F0%/NTZ' Bias: Price Below,
- WSFG Trend: Down.
MSFG Month Nov
- Intermediate-Term
- MSFG Current: -61%
- F0%/NTZ' Bias: Price Below,
- MSFG Trend: Down.
YSFG Year 2026
- Long-Term
- YSFG Current: 198%
- F0%/NTZ' Bias: Price Above,
- YSFG Trend: Up.
Swing Pivots
- (Short-Term) 1. Pvt. Trend: UTrend,
- (Intermediate-Term) 2. HiLo Trend: UTrend,
- 3. Pvt. Evolve: Pvt low 2.6938,
- 4. Pvt. Next: Pvt high 3.1840,
- 5. Levels R: 3.3521,
- 6. Levels S: 2.6938, 1.9334, 0.7831, 0.7749, 0.5444.
Weekly Benchmarks
- (Short-Term) 5 Day: 3.1743 Down Trend,
- (Short-Term) 10 Day: 3.0716 Up Trend,
- (Intermediate-Term) 20 Day: 2.7181 Up Trend,
- (Intermediate-Term) 55 Day: 2.1515 Up Trend,
- (Long-Term) 100 Day: 1.4521 Up Trend,
- (Long-Term) 200 Day: 1.2377 Up Trend.
Recent Trade Signals
- 02 Nov 2026: Short RB 12-26 @ 3.0491 Signals.USAR-MSFG
- 02 Nov 2026: Short RB 12-26 @ 3.0925 Signals.USAR-WSFG
Overall Rating
- Short-Term: Neutral,
- Intermediate-Term: Neutral,
- Long-Term: Bullish.
Key Insights Summary
Price action remains in a powerful long-term expansion, with the weekly market holding well above all major rising benchmarks and the yearly grid maintaining an upside structure. The recent advance has been fast and volatile, reaching the 3.3521 pivot resistance area after a sharp V-shaped recovery from the 2.6938 pivot low. Short- and intermediate-term grid readings remain down and recent WSFG/MSFG signals remain short, creating a countertrend condition against the broader bullish swing structure. The 3.1840 pivot threshold and 3.0716-3.1743 short-term benchmark zone define the recent breakout area, while 2.6938 is the principal swing support beneath the current high.
Chart Analysis ATS AI Generated: 2026-11-05 07:08 for Informational use only, not trading advice. Terms and Risk Disclosure Copyright © 2026. Algo Trading Systems LLC.