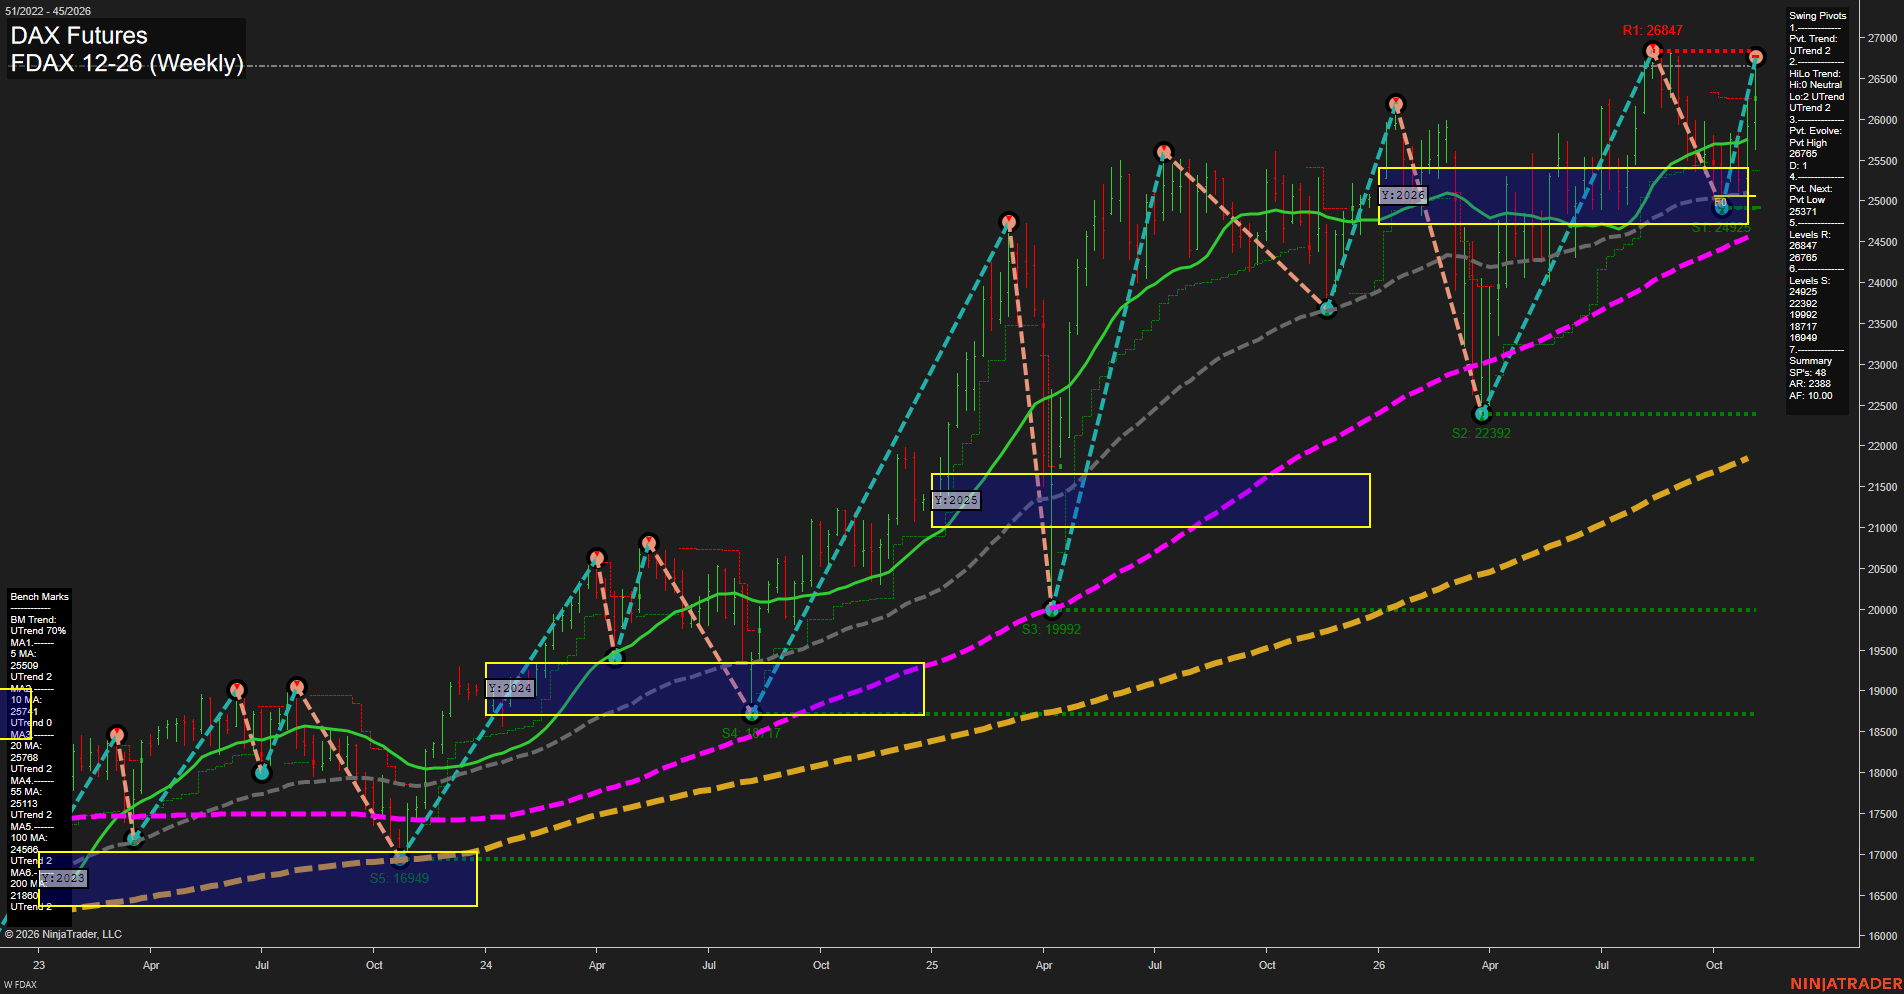
FDAX DAX Futures Weekly Chart Analysis: 2026-Nov-05 07:04 CT
Price Action
- Last: 26847,
- Bars: Medium,
- Mom: fast.
WSFG Weekly
- Short-Term
- WSFG Current: 99%
- F0%/NTZ' Bias: Price Above,
- WSFG Trend: Up.
MSFG Month Nov
- Intermediate-Term
- MSFG Current: 64%
- F0%/NTZ' Bias: Price Above,
- MSFG Trend: Up.
YSFG Year 2026
- Long-Term
- YSFG Current: 47%
- F0%/NTZ' Bias: Price Above,
- YSFG Trend: Up.
Swing Pivots
- (Short-Term) 1. Pvt. Trend: UTrend,
- (Intermediate-Term) 2. HiLo Trend: UTrend,
- 3. Pvt. Evolve: Pvt high 26765,
- 4. Pvt. Next: Pvt low 25371,
- 5. Levels R: 26847, 26765,
- 6. Levels S: 24925, 22392, 19992, 18717, 16949.
Weekly Benchmarks
- (Short-Term) 5 Day: 25590 Up Trend,
- (Short-Term) 10 Day: 25741 Up Trend,
- (Intermediate-Term) 20 Day: 25766 Up Trend,
- (Intermediate-Term) 55 Day: 25113 Up Trend,
- (Long-Term) 100 Day: 24568 Up Trend,
- (Long-Term) 200 Day: 21800 Up Trend.
Recent Trade Signals
- 04 Nov 2026: Long FDAX 12-26 @ 26106 Signals.USAR-WSFG
- 04 Nov 2026: Short FDAX 12-26 @ 25814 Signals.USAR-MSFG
Overall Rating
- Short-Term: Bullish,
- Intermediate-Term: Bullish,
- Long-Term: Bullish.
Key Insights Summary
FDAX has resumed its broad weekly advance and is testing the 26847 pivot-resistance area after a sharp V-shaped recovery from the 24925 support zone. Price is above every benchmark average, with all six averages rising and the shorter averages clustered beneath price, confirming strong upside momentum. The weekly grid is extended at 99%, while the monthly and yearly grids remain positive; this describes a mature but intact multi-timeframe uptrend. The 26765-26847 area defines the immediate high-pivot test, while 25371 is the key reversal threshold for the active short-term pivot structure.
Chart Analysis ATS AI Generated: 2026-11-05 07:04 for Informational use only, not trading advice. Terms and Risk Disclosure Copyright © 2026. Algo Trading Systems LLC.